Note
Go to the end to download the full example code.
Smooth Mean Daily Annual Cycle#
Calculates a smooth mean daily annual cycle.
Before proceeding with all the steps, first import some necessary libraries and packages
import xarray as xr
import easyclimate as ecl
import matplotlib.pyplot as plt
Preprocessed data
Tip
You can download following datasets here:
lats, latn = -20, 20

olr_data = xr.open_dataset('olr-daily_v01r02_19800101_20231231.nc', chunks='auto').sel(lat=slice(lats,latn)).olr
olr_data_daily_annual_cycle_mean = ecl.calc_daily_annual_cycle_mean(olr_data).thin(lat = 2, lon = 5).compute()

olr_data_daily_annual_cycle_mean = ecl.utility.get_compress_xarraydata(olr_data_daily_annual_cycle_mean)
olr_data_daily_annual_cycle_mean.to_netcdf("olr_daily_annual_cycle_mean.nc")
Here, we directly load the data of mean daily annual cycle for outgoing longwave radiation (OLR).
olr_data_daily_annual_cycle_mean = xr.open_dataset("olr_daily_annual_cycle_mean.nc").olr
olr_data_daily_annual_cycle_mean
Simply do a regional average for the tropics
olr_data_ave = olr_data_daily_annual_cycle_mean.mean(dim = ("lon", "lat"))
olr_data_ave.plot()
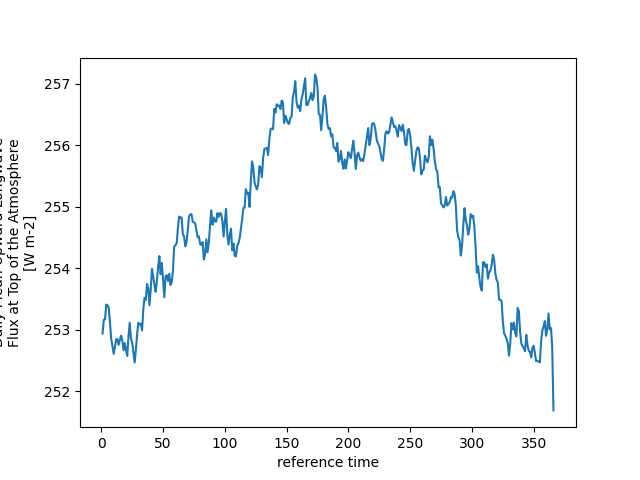
[<matplotlib.lines.Line2D object at 0x7ff426380710>]
By removing excess noise in the mean daily annual cycle through the way of easyclimate.smooth_daily_annual_cycle, we can plot the following:
olr_data_ave_smoothed = ecl.smooth_daily_annual_cycle(olr_data_daily_annual_cycle_mean).mean(dim = ("lon", "lat"))

olr_data_ave.plot(label = "Daily annual cycle mean")
olr_data_ave_smoothed.plot(label = "Smoothed daily annual cycle mean")
plt.legend()
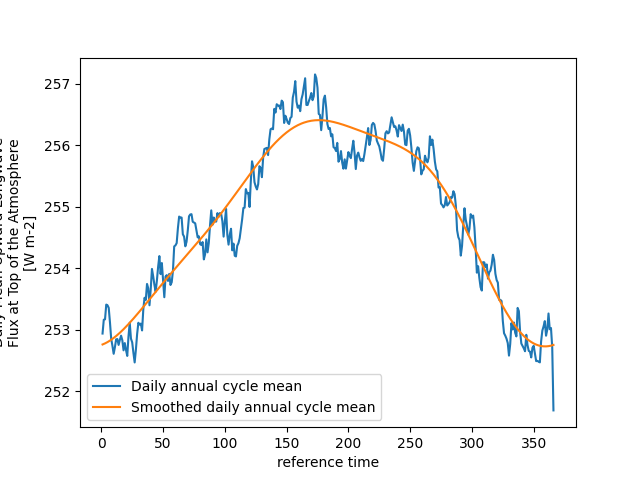
<matplotlib.legend.Legend object at 0x7ff4265d6010>
Total running time of the script: (0 minutes 4.720 seconds)