Note
Go to the end to download the full example code.
Onset and Retreat of Monsoon
Before proceeding with all the steps, first import some necessary libraries and packages
import xarray as xr
import cartopy.crs as ccrs
import easyclimate as ecl
Open precipitable water example data (must be daily frequency data)
pw_data = ecl.open_tutorial_dataset("pr_wtr_eatm_2022").pr_wtr
pw_data
pr_wtr_eatm_2022.nc ━━━━━━━━━━━━━━━━━ 100.0% • 8.4/8.4 MB • 115.8 MB/s • 0:00:00
<xarray.DataArray 'pr_wtr' (time: 365, lat: 73, lon: 144)> Size: 15MB
[3836880 values with dtype=float32]
Coordinates:
  * time     (time) datetime64[ns] 3kB 2022-01-01 2022-01-02 ... 2022-12-31
  * lat      (lat) float32 292B 90.0 87.5 85.0 82.5 ... -82.5 -85.0 -87.5 -90.0
  * lon      (lon) float32 576B 0.0 2.5 5.0 7.5 10.0 ... 350.0 352.5 355.0 357.5
Attributes:
    long_name:     mean Daily Precipitable Water for entire atmosphere
    units:         kg/m^2
    precision:     2
    GRIB_id:       54
    GRIB_name:     PWAT
    var_desc:      Precipitable Water Content
    dataset:       NCEP Reanalysis Daily Averages
    level_desc:    Entire Atmosphere Considered As a Single Layer
    statistic:     Mean
    parent_stat:   Individual Obs
    valid_range:   [-50. 150.]
actual_range: [-4.8 81.075005]- time: 365
- lat: 73
- lon: 144
- ...
[3836880 values with dtype=float32]
- time(time)datetime64[ns]2022-01-01 ... 2022-12-31
- long_name :
- Time
- delta_t :
- 0000-00-01 00:00:00
- standard_name :
- time
- axis :
- T
- avg_period :
- 0000-00-01 00:00:00
- coordinate_defines :
- start
- actual_range :
- [1946016. 1954752.]
array(['2022-01-01T00:00:00.000000000', '2022-01-02T00:00:00.000000000', '2022-01-03T00:00:00.000000000', ..., '2022-12-29T00:00:00.000000000', '2022-12-30T00:00:00.000000000', '2022-12-31T00:00:00.000000000'], shape=(365,), dtype='datetime64[ns]') - lat(lat)float3290.0 87.5 85.0 ... -87.5 -90.0
- units :
- degrees_north
- actual_range :
- [ 90. -90.]
- long_name :
- Latitude
- standard_name :
- latitude
- axis :
- Y
array([ 90. , 87.5, 85. , 82.5, 80. , 77.5, 75. , 72.5, 70. , 67.5, 65. , 62.5, 60. , 57.5, 55. , 52.5, 50. , 47.5, 45. , 42.5, 40. , 37.5, 35. , 32.5, 30. , 27.5, 25. , 22.5, 20. , 17.5, 15. , 12.5, 10. , 7.5, 5. , 2.5, 0. , -2.5, -5. , -7.5, -10. , -12.5, -15. , -17.5, -20. , -22.5, -25. , -27.5, -30. , -32.5, -35. , -37.5, -40. , -42.5, -45. , -47.5, -50. , -52.5, -55. , -57.5, -60. , -62.5, -65. , -67.5, -70. , -72.5, -75. , -77.5, -80. , -82.5, -85. , -87.5, -90. ], dtype=float32) - lon(lon)float320.0 2.5 5.0 ... 352.5 355.0 357.5
- units :
- degrees_east
- long_name :
- Longitude
- actual_range :
- [ 0. 357.5]
- standard_name :
- longitude
- axis :
- X
array([  0. ,   2.5,   5. ,   7.5,  10. ,  12.5,  15. ,  17.5,  20. ,  22.5,
        25. ,  27.5,  30. ,  32.5,  35. ,  37.5,  40. ,  42.5,  45. ,  47.5,
        50. ,  52.5,  55. ,  57.5,  60. ,  62.5,  65. ,  67.5,  70. ,  72.5,
        75. ,  77.5,  80. ,  82.5,  85. ,  87.5,  90. ,  92.5,  95. ,  97.5,
       100. , 102.5, 105. , 107.5, 110. , 112.5, 115. , 117.5, 120. , 122.5,
       125. , 127.5, 130. , 132.5, 135. , 137.5, 140. , 142.5, 145. , 147.5,
       150. , 152.5, 155. , 157.5, 160. , 162.5, 165. , 167.5, 170. , 172.5,
       175. , 177.5, 180. , 182.5, 185. , 187.5, 190. , 192.5, 195. , 197.5,
       200. , 202.5, 205. , 207.5, 210. , 212.5, 215. , 217.5, 220. , 222.5,
       225. , 227.5, 230. , 232.5, 235. , 237.5, 240. , 242.5, 245. , 247.5,
       250. , 252.5, 255. , 257.5, 260. , 262.5, 265. , 267.5, 270. , 272.5,
       275. , 277.5, 280. , 282.5, 285. , 287.5, 290. , 292.5, 295. , 297.5,
       300. , 302.5, 305. , 307.5, 310. , 312.5, 315. , 317.5, 320. , 322.5,
       325. , 327.5, 330. , 332.5, 335. , 337.5, 340. , 342.5, 345. , 347.5,
       350. , 352.5, 355. , 357.5], dtype=float32)
- long_name :
- mean Daily Precipitable Water for entire atmosphere
- units :
- kg/m^2
- precision :
- 2
- GRIB_id :
- 54
- GRIB_name :
- PWAT
- var_desc :
- Precipitable Water Content
- dataset :
- NCEP Reanalysis Daily Averages
- level_desc :
- Entire Atmosphere Considered As a Single Layer
- statistic :
- Mean
- parent_stat :
- Individual Obs
- valid_range :
- [-50. 150.]
- actual_range :
- [-4.8 81.075005]
Calculate the NPWI index using easyclimate.field.monsoon.calc_index_NPWI
See also
Zeng, X., and E. Lu, 2004: Globally Unified Monsoon Onset and Retreat Indexes. J. Climate, 17, 2241–2248, https://journals.ametsoc.org/view/journals/clim/17/11/1520-0442_2004_017_2241_gumoar_2.0.co_2.xml.
Tang Xu, Chen Baode, Liang Ping, Qian Weihong. Definition and features of the north edge of Asian summer monsoon. Acta Meteorologica Sinica (Chinese), 2009, (1): 83-89. doi: http://dx.doi.org/10.11676/qxxb2009.009
<xarray.DataArray 'pr_wtr' (time: 365, lat: 73, lon: 144)> Size: 15MB
array([[[0.11188813, 0.11188813, 0.11188813, ..., 0.11188813,
         0.11188813, 0.11188813],
        [0.09598216, 0.0935412 , 0.09242763, ..., 0.10045148,
         0.09988777, 0.09955256],
        [0.09099708, 0.0909971 , 0.09108527, ..., 0.08562992,
         0.08699901, 0.08949416],
        ...,
        [0.484375  , 0.4631579 , 0.45161286, ..., 0.52763814,
         0.5177665 , 0.49230772],
        [0.5232558 , 0.51445085, 0.5058139 , ..., 0.5257143 ,
         0.52298856, 0.52298856],
        [0.57812494, 0.57812494, 0.57812494, ..., 0.57812494,
         0.57812494, 0.57812494]],

       [[0.13519815, 0.13519815, 0.13519815, ..., 0.13519815,
         0.13519815, 0.13519815],
        [0.10491072, 0.10022272, 0.09799556, ..., 0.10948082,
         0.10886644, 0.10738254],
        [0.10648596, 0.10745402, 0.10852714, ..., 0.09744094,
         0.10068426, 0.1040856 ],
...
        [0.42708334, 0.42105263, 0.4139785 , ..., 0.45226127,
         0.44162434, 0.43589744],
        [0.4127907 , 0.40462428, 0.40697673, ..., 0.3885714 ,
         0.39080462, 0.40229887],
        [0.40624997, 0.40624997, 0.40624997, ..., 0.40624997,
         0.40624997, 0.40624997]],

       [[0.1864802 , 0.1864802 , 0.1864802 , ..., 0.1864802 ,
         0.1864802 , 0.1864802 ],
        [0.1964286 , 0.19265033, 0.18708242, ..., 0.20541763,
         0.20314254, 0.19910516],
        [0.1577928 , 0.1568248 , 0.15600777, ..., 0.16043305,
         0.15933527, 0.15758753],
        ...,
        [0.41666666, 0.41578948, 0.40860215, ..., 0.40703517,
         0.41116747, 0.4051282 ],
        [0.37209302, 0.3699422 , 0.3837209 , ..., 0.34285712,
         0.3448276 , 0.36206898],
        [0.3359375 , 0.3359375 , 0.3359375 , ..., 0.3359375 ,
         0.3359375 , 0.3359375 ]]], shape=(365, 73, 144), dtype=float32)
Coordinates:
  * time     (time) datetime64[ns] 3kB 2022-01-01 2022-01-02 ... 2022-12-31
  * lat      (lat) float32 292B 90.0 87.5 85.0 82.5 ... -82.5 -85.0 -87.5 -90.0
  * lon      (lon) float32 576B 0.0 2.5 5.0 7.5 10.0 ... 350.0 352.5 355.0 357.5
Attributes:
    long_name:     mean Daily Precipitable Water for entire atmosphere
    units:         kg/m^2
    precision:     2
    GRIB_id:       54
    GRIB_name:     PWAT
    var_desc:      Precipitable Water Content
    dataset:       NCEP Reanalysis Daily Averages
    level_desc:    Entire Atmosphere Considered As a Single Layer
    statistic:     Mean
    parent_stat:   Individual Obs
    valid_range:   [-50. 150.]
actual_range: [-4.8 81.075005]- time: 365
- lat: 73
- lon: 144
- 0.1119 0.1119 0.1119 0.1119 0.1119 ... 0.3359 0.3359 0.3359 0.3359
array([[[0.11188813, 0.11188813, 0.11188813, ..., 0.11188813, 0.11188813, 0.11188813], [0.09598216, 0.0935412 , 0.09242763, ..., 0.10045148, 0.09988777, 0.09955256], [0.09099708, 0.0909971 , 0.09108527, ..., 0.08562992, 0.08699901, 0.08949416], ..., [0.484375 , 0.4631579 , 0.45161286, ..., 0.52763814, 0.5177665 , 0.49230772], [0.5232558 , 0.51445085, 0.5058139 , ..., 0.5257143 , 0.52298856, 0.52298856], [0.57812494, 0.57812494, 0.57812494, ..., 0.57812494, 0.57812494, 0.57812494]], [[0.13519815, 0.13519815, 0.13519815, ..., 0.13519815, 0.13519815, 0.13519815], [0.10491072, 0.10022272, 0.09799556, ..., 0.10948082, 0.10886644, 0.10738254], [0.10648596, 0.10745402, 0.10852714, ..., 0.09744094, 0.10068426, 0.1040856 ], ... [0.42708334, 0.42105263, 0.4139785 , ..., 0.45226127, 0.44162434, 0.43589744], [0.4127907 , 0.40462428, 0.40697673, ..., 0.3885714 , 0.39080462, 0.40229887], [0.40624997, 0.40624997, 0.40624997, ..., 0.40624997, 0.40624997, 0.40624997]], [[0.1864802 , 0.1864802 , 0.1864802 , ..., 0.1864802 , 0.1864802 , 0.1864802 ], [0.1964286 , 0.19265033, 0.18708242, ..., 0.20541763, 0.20314254, 0.19910516], [0.1577928 , 0.1568248 , 0.15600777, ..., 0.16043305, 0.15933527, 0.15758753], ..., [0.41666666, 0.41578948, 0.40860215, ..., 0.40703517, 0.41116747, 0.4051282 ], [0.37209302, 0.3699422 , 0.3837209 , ..., 0.34285712, 0.3448276 , 0.36206898], [0.3359375 , 0.3359375 , 0.3359375 , ..., 0.3359375 , 0.3359375 , 0.3359375 ]]], shape=(365, 73, 144), dtype=float32) - time(time)datetime64[ns]2022-01-01 ... 2022-12-31
- long_name :
- Time
- delta_t :
- 0000-00-01 00:00:00
- standard_name :
- time
- axis :
- T
- avg_period :
- 0000-00-01 00:00:00
- coordinate_defines :
- start
- actual_range :
- [1946016. 1954752.]
array(['2022-01-01T00:00:00.000000000', '2022-01-02T00:00:00.000000000', '2022-01-03T00:00:00.000000000', ..., '2022-12-29T00:00:00.000000000', '2022-12-30T00:00:00.000000000', '2022-12-31T00:00:00.000000000'], shape=(365,), dtype='datetime64[ns]') - lat(lat)float3290.0 87.5 85.0 ... -87.5 -90.0
- units :
- degrees_north
- actual_range :
- [ 90. -90.]
- long_name :
- Latitude
- standard_name :
- latitude
- axis :
- Y
array([ 90. , 87.5, 85. , 82.5, 80. , 77.5, 75. , 72.5, 70. , 67.5, 65. , 62.5, 60. , 57.5, 55. , 52.5, 50. , 47.5, 45. , 42.5, 40. , 37.5, 35. , 32.5, 30. , 27.5, 25. , 22.5, 20. , 17.5, 15. , 12.5, 10. , 7.5, 5. , 2.5, 0. , -2.5, -5. , -7.5, -10. , -12.5, -15. , -17.5, -20. , -22.5, -25. , -27.5, -30. , -32.5, -35. , -37.5, -40. , -42.5, -45. , -47.5, -50. , -52.5, -55. , -57.5, -60. , -62.5, -65. , -67.5, -70. , -72.5, -75. , -77.5, -80. , -82.5, -85. , -87.5, -90. ], dtype=float32) - lon(lon)float320.0 2.5 5.0 ... 352.5 355.0 357.5
- units :
- degrees_east
- long_name :
- Longitude
- actual_range :
- [ 0. 357.5]
- standard_name :
- longitude
- axis :
- X
array([  0. ,   2.5,   5. ,   7.5,  10. ,  12.5,  15. ,  17.5,  20. ,  22.5,
        25. ,  27.5,  30. ,  32.5,  35. ,  37.5,  40. ,  42.5,  45. ,  47.5,
        50. ,  52.5,  55. ,  57.5,  60. ,  62.5,  65. ,  67.5,  70. ,  72.5,
        75. ,  77.5,  80. ,  82.5,  85. ,  87.5,  90. ,  92.5,  95. ,  97.5,
       100. , 102.5, 105. , 107.5, 110. , 112.5, 115. , 117.5, 120. , 122.5,
       125. , 127.5, 130. , 132.5, 135. , 137.5, 140. , 142.5, 145. , 147.5,
       150. , 152.5, 155. , 157.5, 160. , 162.5, 165. , 167.5, 170. , 172.5,
       175. , 177.5, 180. , 182.5, 185. , 187.5, 190. , 192.5, 195. , 197.5,
       200. , 202.5, 205. , 207.5, 210. , 212.5, 215. , 217.5, 220. , 222.5,
       225. , 227.5, 230. , 232.5, 235. , 237.5, 240. , 242.5, 245. , 247.5,
       250. , 252.5, 255. , 257.5, 260. , 262.5, 265. , 267.5, 270. , 272.5,
       275. , 277.5, 280. , 282.5, 285. , 287.5, 290. , 292.5, 295. , 297.5,
       300. , 302.5, 305. , 307.5, 310. , 312.5, 315. , 317.5, 320. , 322.5,
       325. , 327.5, 330. , 332.5, 335. , 337.5, 340. , 342.5, 345. , 347.5,
       350. , 352.5, 355. , 357.5], dtype=float32)
- long_name :
- mean Daily Precipitable Water for entire atmosphere
- units :
- kg/m^2
- precision :
- 2
- GRIB_id :
- 54
- GRIB_name :
- PWAT
- var_desc :
- Precipitable Water Content
- dataset :
- NCEP Reanalysis Daily Averages
- level_desc :
- Entire Atmosphere Considered As a Single Layer
- statistic :
- Mean
- parent_stat :
- Individual Obs
- valid_range :
- [-50. 150.]
- actual_range :
- [-4.8 81.075005]
Separation of monsoon affected areas with easyclimate.field.monsoon.find_PW_monsoon_region
<xarray.DataArray 'pr_wtr' (lat: 73, lon: 144)> Size: 11kB
array([[False, False, False, ..., False, False, False],
       [False, False, False, ..., False, False, False],
       [False, False, False, ..., False, False, False],
       ...,
       [False, False, False, ..., False, False, False],
       [False, False, False, ..., False, False, False],
       [False, False, False, ..., False, False, False]], shape=(73, 144))
Coordinates:
  * lat      (lat) float32 292B 90.0 87.5 85.0 82.5 ... -82.5 -85.0 -87.5 -90.0
  * lon      (lon) float32 576B 0.0 2.5 5.0 7.5 10.0 ... 350.0 352.5 355.0 357.5
Attributes:
    long_name:     mean Daily Precipitable Water for entire atmosphere
    units:         kg/m^2
    precision:     2
    GRIB_id:       54
    GRIB_name:     PWAT
    var_desc:      Precipitable Water Content
    dataset:       NCEP Reanalysis Daily Averages
    level_desc:    Entire Atmosphere Considered As a Single Layer
    statistic:     Mean
    parent_stat:   Individual Obs
    valid_range:   [-50. 150.]
actual_range: [-4.8 81.075005]- lat: 73
- lon: 144
- False False False False False False ... False False False False False
array([[False, False, False, ..., False, False, False], [False, False, False, ..., False, False, False], [False, False, False, ..., False, False, False], ..., [False, False, False, ..., False, False, False], [False, False, False, ..., False, False, False], [False, False, False, ..., False, False, False]], shape=(73, 144)) - lat(lat)float3290.0 87.5 85.0 ... -87.5 -90.0
- units :
- degrees_north
- actual_range :
- [ 90. -90.]
- long_name :
- Latitude
- standard_name :
- latitude
- axis :
- Y
array([ 90. , 87.5, 85. , 82.5, 80. , 77.5, 75. , 72.5, 70. , 67.5, 65. , 62.5, 60. , 57.5, 55. , 52.5, 50. , 47.5, 45. , 42.5, 40. , 37.5, 35. , 32.5, 30. , 27.5, 25. , 22.5, 20. , 17.5, 15. , 12.5, 10. , 7.5, 5. , 2.5, 0. , -2.5, -5. , -7.5, -10. , -12.5, -15. , -17.5, -20. , -22.5, -25. , -27.5, -30. , -32.5, -35. , -37.5, -40. , -42.5, -45. , -47.5, -50. , -52.5, -55. , -57.5, -60. , -62.5, -65. , -67.5, -70. , -72.5, -75. , -77.5, -80. , -82.5, -85. , -87.5, -90. ], dtype=float32) - lon(lon)float320.0 2.5 5.0 ... 352.5 355.0 357.5
- units :
- degrees_east
- long_name :
- Longitude
- actual_range :
- [ 0. 357.5]
- standard_name :
- longitude
- axis :
- X
array([  0. ,   2.5,   5. ,   7.5,  10. ,  12.5,  15. ,  17.5,  20. ,  22.5,
        25. ,  27.5,  30. ,  32.5,  35. ,  37.5,  40. ,  42.5,  45. ,  47.5,
        50. ,  52.5,  55. ,  57.5,  60. ,  62.5,  65. ,  67.5,  70. ,  72.5,
        75. ,  77.5,  80. ,  82.5,  85. ,  87.5,  90. ,  92.5,  95. ,  97.5,
       100. , 102.5, 105. , 107.5, 110. , 112.5, 115. , 117.5, 120. , 122.5,
       125. , 127.5, 130. , 132.5, 135. , 137.5, 140. , 142.5, 145. , 147.5,
       150. , 152.5, 155. , 157.5, 160. , 162.5, 165. , 167.5, 170. , 172.5,
       175. , 177.5, 180. , 182.5, 185. , 187.5, 190. , 192.5, 195. , 197.5,
       200. , 202.5, 205. , 207.5, 210. , 212.5, 215. , 217.5, 220. , 222.5,
       225. , 227.5, 230. , 232.5, 235. , 237.5, 240. , 242.5, 245. , 247.5,
       250. , 252.5, 255. , 257.5, 260. , 262.5, 265. , 267.5, 270. , 272.5,
       275. , 277.5, 280. , 282.5, 285. , 287.5, 290. , 292.5, 295. , 297.5,
       300. , 302.5, 305. , 307.5, 310. , 312.5, 315. , 317.5, 320. , 322.5,
       325. , 327.5, 330. , 332.5, 335. , 337.5, 340. , 342.5, 345. , 347.5,
       350. , 352.5, 355. , 357.5], dtype=float32)
- long_name :
- mean Daily Precipitable Water for entire atmosphere
- units :
- kg/m^2
- precision :
- 2
- GRIB_id :
- 54
- GRIB_name :
- PWAT
- var_desc :
- Precipitable Water Content
- dataset :
- NCEP Reanalysis Daily Averages
- level_desc :
- Entire Atmosphere Considered As a Single Layer
- statistic :
- Mean
- parent_stat :
- Individual Obs
- valid_range :
- [-50. 150.]
- actual_range :
- [-4.8 81.075005]
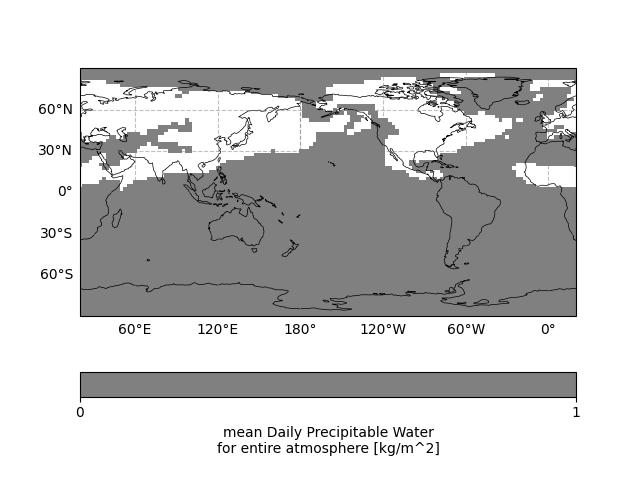
Schematization of monsoon impact areas
fig, ax = ecl.plot.quick_draw_spatial_basemap(central_longitude = 200)
PW_monsoon_region.plot(
    ax = ax,
    cbar_kwargs = {'location': 'bottom'},
    transform = ccrs.PlateCarree(),
    levels = [0, 1],
    colors = ["grey"]
)
<cartopy.mpl.geocollection.GeoQuadMesh object at 0x7f8770067910>
Calculation of monsoon onset with easyclimate.field.monsoon.calc_NPWI_monsoon_onset
/home/runner/work/easyclimate/easyclimate/src/easyclimate/field/monsoon/index_npwi.py:172: FutureWarning: Reductions are applied along the rolling dimension(s) '['time']'. Passing the 'dim' kwarg to reduction operations has no effect.
  ).sum(dim=time_dim)
<xarray.DataArray (lat: 71, lon: 142)> Size: 81kB
array([[199., 199., 199., ..., 198., 198., 198.],
       [199., 199., 199., ..., 199., 199., 199.],
       [199., 199., 199., ..., 199., 199., 199.],
       ...,
       [ nan,  nan,  22., ...,  nan,  nan,  nan],
       [ nan,  nan,  nan, ...,  nan,  nan,  nan],
       [ nan,  nan,  nan, ...,  nan,  nan,  nan]], shape=(71, 142))
Coordinates:
  * lat      (lat) float32 284B 87.5 85.0 82.5 80.0 ... -80.0 -82.5 -85.0 -87.5
* lon (lon) float32 568B 2.5 5.0 7.5 10.0 ... 347.5 350.0 352.5 355.0- lat: 71
- lon: 142
- 199.0 199.0 199.0 199.0 199.0 199.0 199.0 ... nan nan nan nan nan nan
array([[199., 199., 199., ..., 198., 198., 198.], [199., 199., 199., ..., 199., 199., 199.], [199., 199., 199., ..., 199., 199., 199.], ..., [ nan, nan, 22., ..., nan, nan, nan], [ nan, nan, nan, ..., nan, nan, nan], [ nan, nan, nan, ..., nan, nan, nan]], shape=(71, 142)) - lat(lat)float3287.5 85.0 82.5 ... -85.0 -87.5
- units :
- degrees_north
- actual_range :
- [ 90. -90.]
- long_name :
- Latitude
- standard_name :
- latitude
- axis :
- Y
array([ 87.5, 85. , 82.5, 80. , 77.5, 75. , 72.5, 70. , 67.5, 65. , 62.5, 60. , 57.5, 55. , 52.5, 50. , 47.5, 45. , 42.5, 40. , 37.5, 35. , 32.5, 30. , 27.5, 25. , 22.5, 20. , 17.5, 15. , 12.5, 10. , 7.5, 5. , 2.5, 0. , -2.5, -5. , -7.5, -10. , -12.5, -15. , -17.5, -20. , -22.5, -25. , -27.5, -30. , -32.5, -35. , -37.5, -40. , -42.5, -45. , -47.5, -50. , -52.5, -55. , -57.5, -60. , -62.5, -65. , -67.5, -70. , -72.5, -75. , -77.5, -80. , -82.5, -85. , -87.5], dtype=float32) - lon(lon)float322.5 5.0 7.5 ... 350.0 352.5 355.0
- units :
- degrees_east
- long_name :
- Longitude
- actual_range :
- [ 0. 357.5]
- standard_name :
- longitude
- axis :
- X
array([  2.5,   5. ,   7.5,  10. ,  12.5,  15. ,  17.5,  20. ,  22.5,  25. ,
        27.5,  30. ,  32.5,  35. ,  37.5,  40. ,  42.5,  45. ,  47.5,  50. ,
        52.5,  55. ,  57.5,  60. ,  62.5,  65. ,  67.5,  70. ,  72.5,  75. ,
        77.5,  80. ,  82.5,  85. ,  87.5,  90. ,  92.5,  95. ,  97.5, 100. ,
       102.5, 105. , 107.5, 110. , 112.5, 115. , 117.5, 120. , 122.5, 125. ,
       127.5, 130. , 132.5, 135. , 137.5, 140. , 142.5, 145. , 147.5, 150. ,
       152.5, 155. , 157.5, 160. , 162.5, 165. , 167.5, 170. , 172.5, 175. ,
       177.5, 180. , 182.5, 185. , 187.5, 190. , 192.5, 195. , 197.5, 200. ,
       202.5, 205. , 207.5, 210. , 212.5, 215. , 217.5, 220. , 222.5, 225. ,
       227.5, 230. , 232.5, 235. , 237.5, 240. , 242.5, 245. , 247.5, 250. ,
       252.5, 255. , 257.5, 260. , 262.5, 265. , 267.5, 270. , 272.5, 275. ,
       277.5, 280. , 282.5, 285. , 287.5, 290. , 292.5, 295. , 297.5, 300. ,
       302.5, 305. , 307.5, 310. , 312.5, 315. , 317.5, 320. , 322.5, 325. ,
       327.5, 330. , 332.5, 335. , 337.5, 340. , 342.5, 345. , 347.5, 350. ,
       352.5, 355. ], dtype=float32)
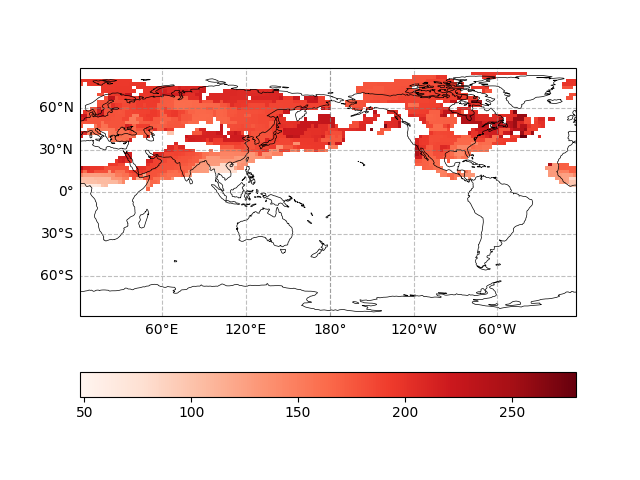
Analyzing and mapping the monsoon onset time in the monsoon impact area
fig, ax = ecl.plot.quick_draw_spatial_basemap(central_longitude = 180)
monsoon_onset_date.where(PW_monsoon_region).plot(
    ax = ax,
    cbar_kwargs = {'location': 'bottom'},
    transform = ccrs.PlateCarree(),
    cmap = 'Reds'
)
<cartopy.mpl.geocollection.GeoQuadMesh object at 0x7f876fb46050>
Calculation of monsoon retreat time with easyclimate.field.monsoon.calc_NPWI_monsoon_retreat
/home/runner/work/easyclimate/easyclimate/src/easyclimate/field/monsoon/index_npwi.py:275: FutureWarning: Reductions are applied along the rolling dimension(s) '['time']'. Passing the 'dim' kwarg to reduction operations has no effect.
  ).sum(dim=time_dim)
<xarray.DataArray (lat: 71, lon: 142)> Size: 81kB
array([[218., 218., 218., ..., 218., 218., 218.],
       [217., 222., 222., ..., 215., 215., 215.],
       [218., 222., 222., ..., 203., 216., 217.],
       ...,
       [ nan,  nan,  28., ...,  nan,  nan,  nan],
       [ nan,  nan,  nan, ...,  nan,  nan,  nan],
       [ nan,  nan,  nan, ...,  nan,  nan,  nan]], shape=(71, 142))
Coordinates:
  * lat      (lat) float32 284B 87.5 85.0 82.5 80.0 ... -80.0 -82.5 -85.0 -87.5
* lon (lon) float32 568B 2.5 5.0 7.5 10.0 ... 347.5 350.0 352.5 355.0- lat: 71
- lon: 142
- 218.0 218.0 218.0 214.0 214.0 214.0 214.0 ... nan nan nan nan nan nan
array([[218., 218., 218., ..., 218., 218., 218.], [217., 222., 222., ..., 215., 215., 215.], [218., 222., 222., ..., 203., 216., 217.], ..., [ nan, nan, 28., ..., nan, nan, nan], [ nan, nan, nan, ..., nan, nan, nan], [ nan, nan, nan, ..., nan, nan, nan]], shape=(71, 142)) - lat(lat)float3287.5 85.0 82.5 ... -85.0 -87.5
- units :
- degrees_north
- actual_range :
- [ 90. -90.]
- long_name :
- Latitude
- standard_name :
- latitude
- axis :
- Y
array([ 87.5, 85. , 82.5, 80. , 77.5, 75. , 72.5, 70. , 67.5, 65. , 62.5, 60. , 57.5, 55. , 52.5, 50. , 47.5, 45. , 42.5, 40. , 37.5, 35. , 32.5, 30. , 27.5, 25. , 22.5, 20. , 17.5, 15. , 12.5, 10. , 7.5, 5. , 2.5, 0. , -2.5, -5. , -7.5, -10. , -12.5, -15. , -17.5, -20. , -22.5, -25. , -27.5, -30. , -32.5, -35. , -37.5, -40. , -42.5, -45. , -47.5, -50. , -52.5, -55. , -57.5, -60. , -62.5, -65. , -67.5, -70. , -72.5, -75. , -77.5, -80. , -82.5, -85. , -87.5], dtype=float32) - lon(lon)float322.5 5.0 7.5 ... 350.0 352.5 355.0
- units :
- degrees_east
- long_name :
- Longitude
- actual_range :
- [ 0. 357.5]
- standard_name :
- longitude
- axis :
- X
array([  2.5,   5. ,   7.5,  10. ,  12.5,  15. ,  17.5,  20. ,  22.5,  25. ,
        27.5,  30. ,  32.5,  35. ,  37.5,  40. ,  42.5,  45. ,  47.5,  50. ,
        52.5,  55. ,  57.5,  60. ,  62.5,  65. ,  67.5,  70. ,  72.5,  75. ,
        77.5,  80. ,  82.5,  85. ,  87.5,  90. ,  92.5,  95. ,  97.5, 100. ,
       102.5, 105. , 107.5, 110. , 112.5, 115. , 117.5, 120. , 122.5, 125. ,
       127.5, 130. , 132.5, 135. , 137.5, 140. , 142.5, 145. , 147.5, 150. ,
       152.5, 155. , 157.5, 160. , 162.5, 165. , 167.5, 170. , 172.5, 175. ,
       177.5, 180. , 182.5, 185. , 187.5, 190. , 192.5, 195. , 197.5, 200. ,
       202.5, 205. , 207.5, 210. , 212.5, 215. , 217.5, 220. , 222.5, 225. ,
       227.5, 230. , 232.5, 235. , 237.5, 240. , 242.5, 245. , 247.5, 250. ,
       252.5, 255. , 257.5, 260. , 262.5, 265. , 267.5, 270. , 272.5, 275. ,
       277.5, 280. , 282.5, 285. , 287.5, 290. , 292.5, 295. , 297.5, 300. ,
       302.5, 305. , 307.5, 310. , 312.5, 315. , 317.5, 320. , 322.5, 325. ,
       327.5, 330. , 332.5, 335. , 337.5, 340. , 342.5, 345. , 347.5, 350. ,
       352.5, 355. ], dtype=float32)
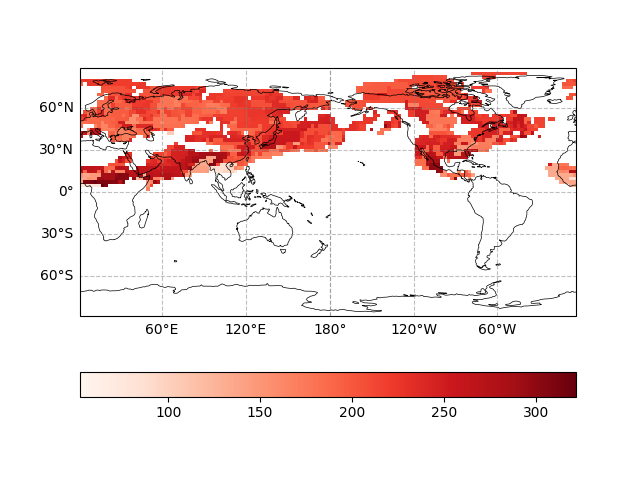
Analyzing and mapping the monsoon retreat time in the monsoon impact area
fig, ax = ecl.plot.quick_draw_spatial_basemap(central_longitude = 180)
monsoon_retreat_date.where(PW_monsoon_region).plot(
    ax = ax,
    cbar_kwargs = {'location': 'bottom'},
    transform = ccrs.PlateCarree(),
    cmap = 'Reds'
)
<cartopy.mpl.geocollection.GeoQuadMesh object at 0x7f876fa5e050>
Total running time of the script: (0 minutes 9.982 seconds)