Note
Go to the end to download the full example code.
Coriolis Coefficient with Latitude#
Since Earth is rotating, water and gas on or above its surface have angular momentum. When a fluid moves from one latitude, it changes the distance from the axis of rotation, so the rate of rotation changes to maintain constant angular momentum.
As pressure gradient force (PGF) pushes air toward the poles, it gets closer to the axis of rotation, and as with the skater, the air moves faster in its west-to-east motion, moving to the east of the air it is moving into. And when air moves toward the equator, it slows its west-to-east motion and moves to the west of the air it is moving into. When looking along the initial path of the northward or southward push, in the Northern Hemisphere, the air moves to the right. In the Southern Hemisphere, the air moves to the left of the initial push.
But what about the air that moves initially to the west or east? It is staying at the same latitude, so it isn’t changing its distance to the axis of rotation. In the case of moving eastward, the air will be moving faster than it needs to stay at the Earth’s surface, it moves perpendicularly away from the axis of rotation (see spinning marshmallow activity). Gravity pulls the air back to the ground, but this is toward the center of the Earth, so the air moves toward the equator. The air moves to the right of the eastward push in the northern hemisphere and to the left of the push in the southern hemisphere.
When air moves westward, it is moving slower than air that would stay at the same distance from the axis of rotation, so it would move perpendicularly toward the axis. But the ground gets in the way, and the slope of the surface would push it toward the poles (remember the air is not sinking toward the Earth’s center but perpendicular to the axis of rotation). And, as with the other cases, the air is moved to the right of the westward push in the northern hemisphere and to the left in the southern.
Notice that the only time the eastward or westward pushed air won’t bend is at the equator since the gravitational pull toward the center of the Earth and the perpendicular direction to the axis of rotation are parallel. This gives an indication that there isn’t a Coriolis force acting on air moving along the equator, so there must be a relationship between latitude and the magnitude of Coriolis force. Coriolis force is proportional to sin(latitude), so it is at a maximum at the poles (\(\sin 90 ^\circ = 1\)) and zero at the equator (\(\sin 0 ^\circ = 0\)). In calculations, meteorologists use the Coriolis coefficient which is
Where
\(\Omega\): Earth’s angular velocity (\(7.292 \cdot 10 ^{-5} \ \mathrm{rad/s}\)).
\(\phi\): the latitude in degrees.
See also
James F. Price: A Coriolis tutorial Woods, Hole Oceanographic Institute (2003)
Before proceeding with all the steps, first import some necessary libraries and packages
import xarray as xr
import numpy as np
import matplotlib.pyplot as plt
import easyclimate as ecl
First, we create a latitude array ranging from -90° (South Pole) to 90° (North Pole) with 21 equally spaced points:
lat_array = xr.DataArray(
    np.linspace(-90, 90, 21),
    dims = 'lat',
    coords={'lat': np.linspace(-90, 90, 21)}
)
lat_array
Using the easyclimate.physics.geo.get_coriolis_parameter function to calculate
the Coriolis coefficient at each latitude point. The function automatically
handles the conversion from degrees to radians and applies the formula.
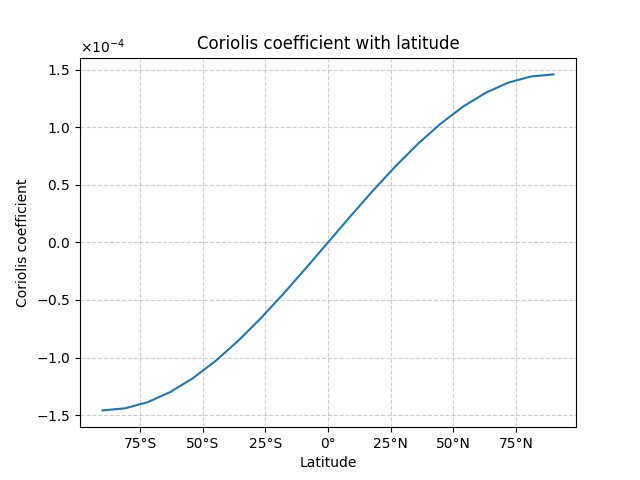
Plot the relationship between latitude and Coriolis coefficient to demonstrate:
Zero at the equator (0° latitude)
Maximum positive value at North Pole (90° latitude)
Maximum negative value at South Pole (-90° latitude)
Anti-symmetric about the equator
fig, ax = plt.subplots()

co_coeff.plot(ax=ax)

# Format the y-axis to use scientific notation for small values
ax.yaxis.set_major_formatter(plt.ScalarFormatter(useMathText=True))
ax.yaxis.get_major_formatter().set_powerlimits((0, 0))

# Format latitude labels on x-axis
ecl.plot.set_lat_format_axis(axis="x")

# Add grid lines for better readability
ax.grid(True, linestyle='--', alpha=0.6)

# Set plot titles and labels
ax.set_title("Coriolis coefficient with latitude")
ax.set_xlabel("Latitude")
ax.set_ylabel("Coriolis coefficient")
Text(30.045830620659714, 0.5, 'Coriolis coefficient')
Total running time of the script: (0 minutes 0.468 seconds)