easyclimate_map
Submodules
Attributes
Functions
|
|
|
Get China national boundary data in either line or polygon format. |
|
Get China provincial-level administrative boundary data. |
|
Get major river systems in China (Level 1 rivers). |
|
Get tertiary river systems in China (Level 3 rivers). |
|
Get first-level administrative center locations in China. |
|
Get second-level administrative center locations in China. |
|
Get Tibetan Plateau basins data in polygon format. |
|
Read a shapefile directly from a 7z archive without extracting to disk. |
|
Extract the outer boundary (exterior ring only) from a GeoDataFrame. |
|
Convert boundary lines (LineString or MultiLineString) to polygon geometries. |
|
Convert geometries from a GeoDataFrame into matplotlib clipping paths. |
Clip a GeoDataFrame using a rectangular bounding box. |
Package Contents
- easyclimate_map.__version__ = '2026.3.0'
- easyclimate_map.show_versions() str
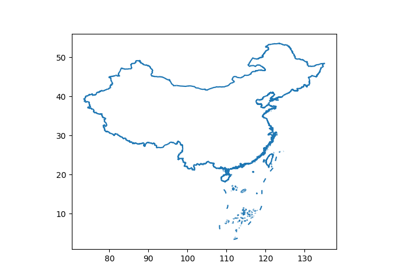
- easyclimate_map.get_zh_CN_nation(type: Literal['line', 'polygon'] = 'line') geopandas.GeoDataFrame
Get China national boundary data in either line or polygon format.
This function returns geographic boundary data for China’s national borders. The data includes mainland China’s coastline and land borders with neighboring countries.
Parameters
- type{“line”, “polygon”}, default “line”
Geometry type to return: - “line”: Boundary lines (coastlines and land borders) - “polygon”: Polygonal representation of China’s territory
Returns
- geopandas.GeoDataFrame
GeoDataFrame containing China’s national boundary features. The CRS is typically EPSG:4326 (WGS84).
Notes
Data source: Standard Chinese cartographic data
Encoding: GB2312 (Chinese character encoding)
Includes territories claimed by China (e.g., Taiwan, South China Sea islands)
Example(s) related to the function
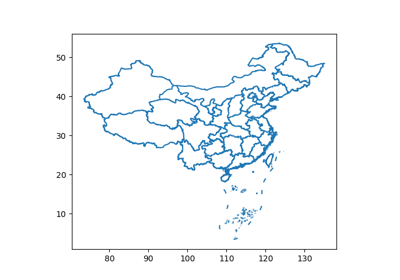
- easyclimate_map.get_zh_CN_provinces(type: Literal['line', 'polygon'] = 'line') geopandas.GeoDataFrame
Get China provincial-level administrative boundary data.
Returns boundary data for all provincial-level divisions in China, including: - 23 provinces - 5 autonomous regions - 4 municipalities - 2 special administrative regions (Hong Kong, Macau)
Parameters
- type{“line”, “polygon”}, default “line”
Geometry type to return: - “line”: Provincial boundary lines - “polygon”: Polygonal representation of provincial territories
Returns
- geopandas.GeoDataFrame
GeoDataFrame with provincial boundary features, including attributes for province names and administrative codes.
Notes
Data follows Chinese administrative divisions as of the data source date
Taiwan is included as a province of China according to the data source
South China Sea islands are typically included in Hainan province
Example(s) related to the function
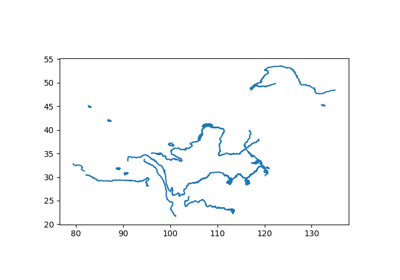
- easyclimate_map.get_zh_CN_river1(type: Literal['line', 'polygon'] = 'line') geopandas.GeoDataFrame
Get major river systems in China (Level 1 rivers).
Returns geographic data for China’s primary river systems, including: - Major rivers (Yangtze, Yellow River, Pearl River, etc.) - Large lakes and reservoirs - Important water bodies
Parameters
- type{“line”, “polygon”}, default “line”
Geometry type to return: - “line”: River centerlines and watercourse boundaries - “polygon”: Water body areas (lakes, reservoirs, wide rivers)
Returns
- geopandas.GeoDataFrame
GeoDataFrame containing major river and water body features. May include attributes for river names and hydrological classifications.
Example(s) related to the function
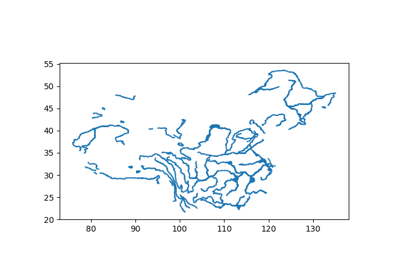
- easyclimate_map.get_zh_CN_river3(type: Literal['line', 'polygon'] = 'line') geopandas.GeoDataFrame
Get tertiary river systems in China (Level 3 rivers).
Returns geographic data for smaller rivers and streams, including: - Tributaries and smaller watercourses - Minor lakes and ponds - Drainage networks
Parameters
- type{“line”, “polygon”}, default “line”
Geometry type to return: - “line”: Stream centerlines and minor watercourses - “polygon”: Small water body areas
Returns
- geopandas.GeoDataFrame
GeoDataFrame containing tertiary river and water body features. Provides more detailed hydrological data than Level 1 rivers.
Notes
This dataset offers higher spatial resolution than Level 1 rivers
May not include complete coverage for all regions
Example(s) related to the function
- easyclimate_map.get_zh_CN_1st_administration() geopandas.GeoDataFrame
Get first-level administrative center locations in China.
Returns point locations for administrative centers at the provincial level, including: - Provincial capitals - Municipal government seats - Autonomous region capitals
Returns
- geopandas.GeoDataFrame
GeoDataFrame with point features representing administrative centers. Includes attributes for center names, administrative levels, and codes.
Notes
Typically includes 34 administrative centers (31 provincial-level + 3 special)
Coordinates represent government seat locations
Example(s) related to the function
- easyclimate_map.get_zh_CN_2nd_administration() geopandas.GeoDataFrame
Get second-level administrative center locations in China.
Returns point locations for administrative centers at the prefecture level, including: - Prefecture-level city governments - Autonomous prefecture capitals - League administrative centers
Returns
- geopandas.GeoDataFrame
GeoDataFrame with point features representing prefecture-level administrative centers. Includes detailed location attributes.
Notes
Covers approximately 333 prefecture-level divisions in China
Includes both urban and rural administrative centers
Example(s) related to the function
- easyclimate_map.get_Tibetan_Plateau_basins() geopandas.GeoDataFrame
Get Tibetan Plateau basins data in polygon format.
Tip
Zhang, G. (2019). Dataset of river basins map over the TP(2016). National Tibetan Plateau / Third Pole Environment Data Center. https://doi.org/10.11888/BaseGeography.tpe.249465.file. https://cstr.cn/18406.11.BaseGeography.tpe.249465.file.
Zhang, G.Q., Yao, T.D., Xie, H.J., Kang, S.C., &Lei, Y.B. (2013). Increased mass over the Tibetan Plateau: From lakes or glaciers? Geophysical Research Letters, 40(10), 2125-2130. https://doi.org/10.1002/grl.50462
Returns
- geopandas.GeoDataFrame
GeoDataFrame containing Tibetan Plateau basins. The CRS is typically EPSG:4326 (WGS84).
Example(s) related to the function
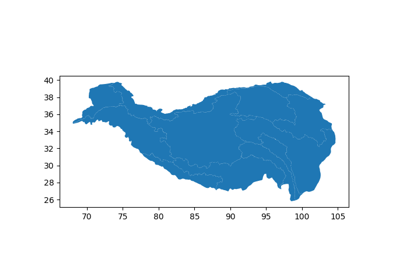
Tibetan Plateau (Qinghai-Xizang Plateau) basins Map
Tibetan Plateau (Qinghai-Xizang Plateau) basins Map
- easyclimate_map.read_shapefile_from_7z(filepath: str, **kwargs) geopandas.GeoDataFrame
Read a shapefile directly from a 7z archive without extracting to disk.
This function extracts a shapefile from a compressed 7z archive into a temporary directory, loads it as a GeoDataFrame using GeoPandas, and returns the result. All keyword arguments are passed through to gpd.read_file().
Parameters
- filepathstr
Path to the 7z archive containing the shapefile.
- **kwargsdict, optional
Additional keyword arguments to pass to gpd.read_file(). Common arguments include: - bbox : tuple
Filter by bounding box (minx, miny, maxx, maxy)
- maskgeometry
Filter by geometry mask
- rowsint
Number of rows to read
- encodingstr
File encoding (e.g., ‘utf-8’)
- driverstr
GDAL/OGR driver name
Returns
- geopandas.GeoDataFrame
A GeoDataFrame containing the shapefile data.
Raises
- FileNotFoundError
If the 7z file doesn’t exist or doesn’t contain any .shp files.
Notes
The function creates a temporary directory that is automatically cleaned up.
Only the first .shp file found in the archive will be read.
Shapefile companion files (.shx, .dbf, .prj) must also be present in the archive.
Examples
>>> gdf = read_shapefile_from_7z('data.7z')
>>> gdf = read_shapefile_from_7z('data.7z', bbox=(xmin, ymin, xmax, ymax))
>>> gdf = read_shapefile_from_7z('data.7z', encoding='utf-8', rows=1000)
See Also
geopandas.read_file : For available keyword arguments and reading options.
- easyclimate_map.extract_outer_boundary(gdf, dissolve_by=None) geopandas.GeoDataFrame
Extract the outer boundary (exterior ring only) from a GeoDataFrame.
This function dissolves all features in a GeoDataFrame and extracts only the outer boundaries, excluding any interior holes or isolated internal lines.
Parameters
- gdfgeopandas.GeoDataFrame
Input GeoDataFrame containing polygon or multipolygon geometries.
- dissolve_bystr or list of str, optional
Column name(s) to dissolve by. If None (default), dissolves all features into a single geometry.
Returns
- geopandas.GeoDataFrame
A GeoDataFrame containing only the outer boundary lines (LineString or MultiLineString geometry).
Examples
>>> import geopandas as gpd
>>> # Load your data
>>> gdf = gpd.read_file('basins.shp')
>>>
>>> # Extract outer boundary of all features
>>> boundary = extract_outer_boundary(gdf)
>>>
>>> # Extract boundary by specific attribute
>>> boundary = extract_outer_boundary(gdf, dissolve_by='BasinName')
>>>
>>> # Save the result
>>> boundary.to_file('boundary.shp')
Notes
For MULTIPOLYGON geometries, extracts the exterior ring of each polygon part
Interior holes (e.g., lakes, enclaves) are excluded
The output CRS is preserved from the input GeoDataFrame
If input contains multiple disconnected regions, output will be MultiLineString
See Also
geopandas.GeoDataFrame.dissolve : Dissolve geometries shapely.geometry.Polygon.exterior : Extract exterior ring
Example(s) related to the function
Tibetan Plateau (Qinghai-Xizang Plateau) basins Map
Tibetan Plateau (Qinghai-Xizang Plateau) basins Map
- easyclimate_map.transfer_boundary_to_polygon(boundary_gdf) geopandas.GeoDataFrame
Convert boundary lines (LineString or MultiLineString) to polygon geometries.
This function reconstructs polygon geometries from their boundary lines. It assumes the boundary lines form closed rings.
Parameters
- boundary_gdfgeopandas.GeoDataFrame
Input GeoDataFrame containing LineString or MultiLineString geometries representing polygon boundaries.
Returns
- geopandas.GeoDataFrame
A GeoDataFrame containing reconstructed Polygon or MultiPolygon geometries.
Examples
>>> import geopandas as gpd
>>> # Extract boundary first
>>> boundary = extract_outer_boundary(gdf)
>>>
>>> # Convert boundary back to polygon
>>> polygon = boundary_to_polygon(boundary)
>>>
>>> # Save the result
>>> polygon.to_file('reconstructed_polygon.shp')
Notes
Input boundary lines must form closed rings
For MultiLineString input, creates MultiPolygon output
The output CRS is preserved from the input GeoDataFrame
This creates simple polygons without interior holes
See Also
extract_outer_boundary(): Extract outer boundary from polygons shapely.geometry.Polygon : Polygon constructorExample(s) related to the function
Tibetan Plateau (Qinghai-Xizang Plateau) basins Map
Tibetan Plateau (Qinghai-Xizang Plateau) basins Map
- easyclimate_map.get_geometry_path(gdf: geopandas.geodataframe.GeoDataFrame, ax: matplotlib.axes.Axes) easyclimate_map.core.datanode.DataNode
Convert geometries from a GeoDataFrame into matplotlib clipping paths.
This function extracts geometries from a GeoDataFrame, projects them to the coordinate system of the given matplotlib axis, and converts them into matplotlib Path objects suitable for clipping or other operations.
Parameters
- gdf
geopandas.GeoDataFrame The GeoDataFrame containing geometries to be converted. Geometries should be in geographic coordinates (longitude/latitude in degrees) using the EPSG:4326 (PlateCarree) coordinate reference system.
- ax
matplotlib.axes.Axes The matplotlib axis with a cartopy projection. The axis must have a cartopy.crs projection set, which will be used to transform the geometries from geographic coordinates to the map’s coordinate system.
Returns
easyclimate-map.DataNodeA DataNode object containing two items:
- clip_path:
matplotlib.path.Path A compound Path object containing all projected geometries.
- clip_path:
- transform_clip_path:
matplotlib.transforms.TransformedPath The same Path object transformed to data coordinates of the axis.
- transform_clip_path:
Notes
The function assumes input geometries are in geographic coordinates (EPSG:4326 / PlateCarree).
The axis must use a cartopy projection. Standard matplotlib axes without cartopy will not work.
The resulting Path objects can be used for clipping matplotlib plots or other operations that require vector paths.
Examples
>>> import matplotlib.pyplot as plt
>>> import cartopy.crs as ccrs
>>> import geopandas as gpd
>>>
>>> # Create a map with cartopy projection
>>> fig, ax = plt.subplots(subplot_kw={'projection': ccrs.PlateCarree()})
>>> # Load GeoDataFrame (assumed to be in geographic coordinates)
>>> gdf = gpd.read_file('path/to/shapefile.shp')
>>> # Convert geometries to clipping paths
>>> paths = get_geometry_path(gdf, ax)
>>> # Use the paths for clipping
>>> im = ax.imshow(data, transform=ccrs.PlateCarree())
>>> im.set_clip_path(paths['transform_clip_path'])
See Also
cartopy.mpl.path.shapely_to_path: Converts shapely geometries to matplotlib pathsmatplotlib.path.Path.make_compound_path: Combines multiple paths into onematplotlib.transforms.TransformedPath: Applies transformations to paths- gdf
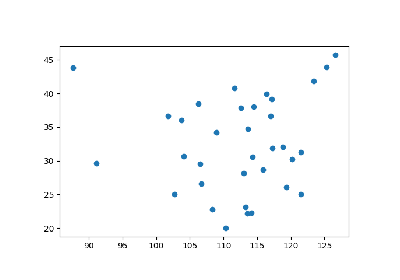
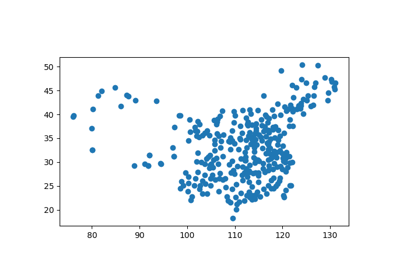
- easyclimate_map.clip_rectangle_geometry(gdf: geopandas.geodataframe.GeoDataFrame, *args) geopandas.geodataframe.GeoDataFrame
Clip a GeoDataFrame using a rectangular bounding box.
Supports two parameter styles: 1. Four separate arguments: clip_rectangle_geometry(gdf, lon1, lon2, lat1, lat2) 2. A single list/tuple: clip_rectangle_geometry(gdf, [lon1, lon2, lat1, lat2])
Parameters
- gdf
geopandas.GeoDataFrame The GeoDataFrame to clip
- *argsUnion[float, List[float], Tuple[float]]
Either four separate float arguments (lon1, lon2, lat1, lat2) or a single list/tuple containing four floats
Returns
geopandas.GeoDataFrameThe clipped GeoDataFrame
Examples
>>> # Method 1: Four separate arguments
>>> clipped = clip_rectangle_geometry(gdf, 110, 130, 30, 40)
>>>
>>> # Method 2: Single list argument
>>> clipped = clip_rectangle_geometry(gdf, [110, 130, 30, 40])
- gdf