Note
Go to the end to download the full example code.
Tibetan Plateau (Qinghai-Xizang Plateau) basins Map
This example demonstrates how to load, visualize, and process basin boundaries
over the Tibetan Plateau using easyclimate-map. We show how to dissolve
multiple basin polygons, extract their outer boundaries, and reconstruct polygon
geometries from boundary lines.
Import necessary libraries
Import easyclimate-map for loading Tibetan Plateau basin data, matplotlib.pyplot
for plotting, and cartopy.crs for map projections. These libraries together support
the retrieval and visualization of geographic data.
import easyclimate_map as eclmap
import matplotlib.pyplot as plt
import cartopy.crs as ccrs
<easyclimate-map notice>: Maps are provided as-is. Users assume all risk. No
liability. No political or territorial claims.
Load Tibetan Plateau basin data
Load the 12 sub-basins over the Tibetan Plateau using the built-in dataset.
tp_basins = eclmap.get_Tibetan_Plateau_basins()
tp_basins
<easyclimate-map notice>: Please refer to the data usage instructions before
using the data.https://doi.org/10.11888/BaseGeography.tpe.249465.file
The dataset contains 12 major river basins including AmuDayra, Brahmaputra, Ganges, Hexi, Indus, Inner, Mekong, Qaidam, Salween, Tarim, Yangtze, Yellow.
Tip
Zhang, G. (2019). Dataset of river basins map over the TP(2016). National Tibetan Plateau / Third Pole Environment Data Center. https://doi.org/10.11888/BaseGeography.tpe.249465.file. https://cstr.cn/18406.11.BaseGeography.tpe.249465.file.
Zhang, G.Q., Yao, T.D., Xie, H.J., Kang, S.C., &Lei, Y.B. (2013). Increased mass over the Tibetan Plateau: From lakes or glaciers? Geophysical Research Letters, 40(10), 2125-2130. https://doi.org/10.1002/grl.50462
Simple visualization
Create a quick plot of all basin polygons using the default plot method.
tp_basins.plot()

<Axes: >
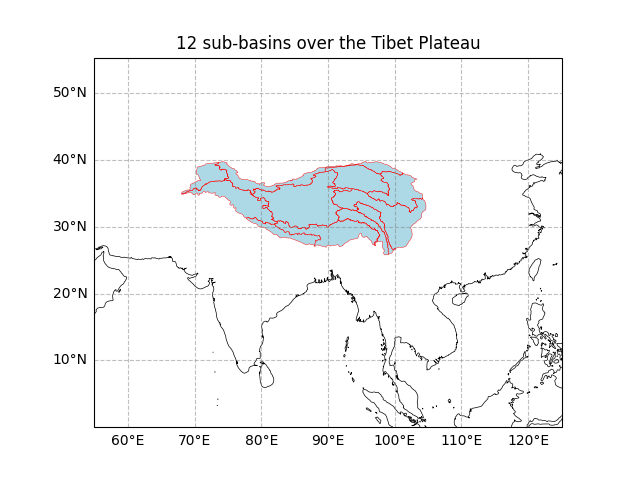
Detailed map with Cartopy
Create a more detailed map with geographic context using Cartopy projections, including coastlines and grid lines.
fig, ax = plt.subplots(subplot_kw={"projection": ccrs.PlateCarree(central_longitude=180)})

ax.set_extent([55, 125, 0, 50])
ax.gridlines(
    draw_labels=["left", "bottom"],
    color="grey",
    alpha=0.5, linestyle="--"
)
ax.coastlines(color="k", lw = 0.5, resolution = "50m")
ax.add_geometries(
    tp_basins.geometry,
    crs = ccrs.PlateCarree(),
    facecolor = "lightblue",
    edgecolor = "r",
    lw = 0.3
)
ax.set_title("12 sub-basins over the Tibet Plateau")
Text(0.5, 1.0, '12 sub-basins over the Tibet Plateau')
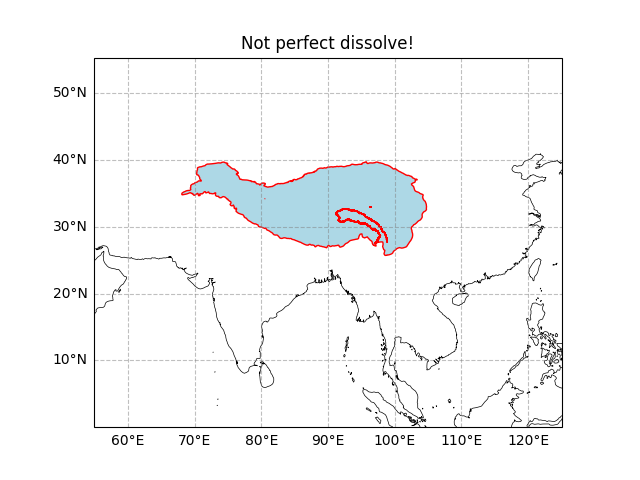
Dissolve all basins
Merge all basin polygons into a single geometry using the dissolve() method.
dissolved_tp_basins = tp_basins.dissolve()
Visualize dissolved result
Plot the dissolved basin geometry. Note that this may show internal boundaries due to holes or disconnected regions in the multipolygon.
fig, ax = plt.subplots(subplot_kw={"projection": ccrs.PlateCarree(central_longitude=180)})

ax.set_extent([55, 125, 0, 50])
ax.gridlines(
    draw_labels=["left", "bottom"],
    color="grey",
    alpha=0.5, linestyle="--"
)
ax.coastlines(color="k", lw = 0.5, resolution = "50m")
ax.add_geometries(
    dissolved_tp_basins.geometry,
    crs = ccrs.PlateCarree(),
    facecolor = "lightblue",
    edgecolor = "r",
    lw = 1
)
ax.set_title("Not perfect dissolve!")
Text(0.5, 1.0, 'Not perfect dissolve!')
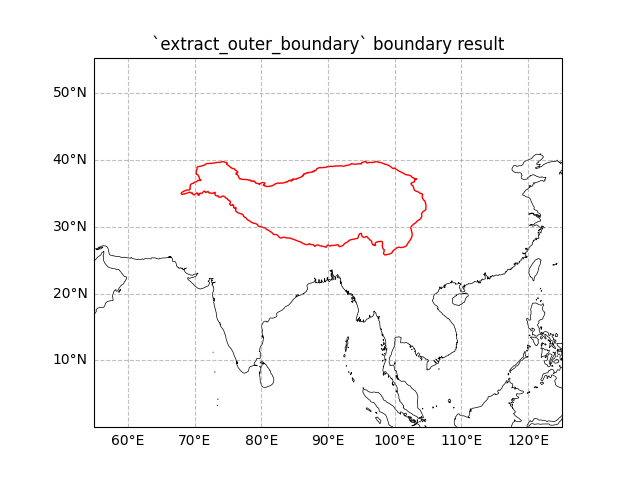
Extract outer boundary only
Extract only the outer boundary lines from the dissolved basins, excluding any
internal holes or boundaries using the extract_outer_boundary() function.
tp_basins_boundary = eclmap.extract_outer_boundary(tp_basins)
tp_basins_boundary
This function dissolves all features and extracts only the exterior rings, removing interior holes and isolated internal lines.
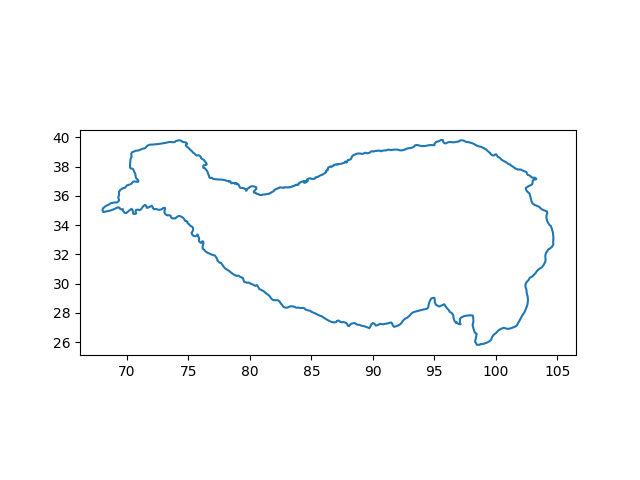
Plot extracted boundary
Visualize the extracted boundary as line geometry.
tp_basins_boundary.plot()
<Axes: >
Map view of boundary
Display the extracted boundary on a map with geographic context.
fig, ax = plt.subplots(subplot_kw={"projection": ccrs.PlateCarree(central_longitude=180)})

ax.set_extent([55, 125, 0, 50])
ax.gridlines(
    draw_labels=["left", "bottom"],
    color="grey",
    alpha=0.5, linestyle="--"
)
ax.coastlines(color="k", lw = 0.5, resolution = "50m")
ax.add_geometries(
    tp_basins_boundary.geometry,
    crs = ccrs.PlateCarree(),
    facecolor = "none",
    edgecolor = "r",
    lw = 1
)
ax.set_title("`extract_outer_boundary` boundary result")
Text(0.5, 1.0, '`extract_outer_boundary` boundary result')
Reconstruct polygon from boundary
Convert the boundary line geometry back to a polygon using the
transfer_boundary_to_polygon() function.
tp_basins_polygon = eclmap.transfer_boundary_to_polygon(tp_basins_boundary)
tp_basins_polygon
This function reconstructs polygon geometries from their boundary lines, creating simple polygons without interior holes.
Plot reconstructed polygon
Visualize the reconstructed polygon geometry.
tp_basins_polygon.plot()
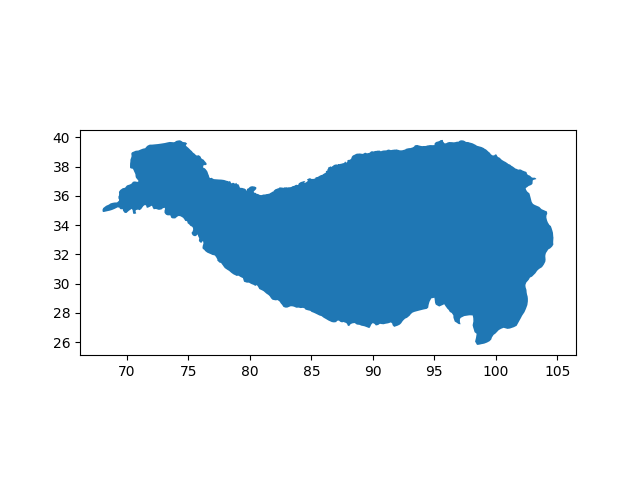
<Axes: >
Final map with reconstructed polygon
Display the final reconstructed polygon on a map, showing a clean outer boundary without internal lines.
fig, ax = plt.subplots(subplot_kw={"projection": ccrs.PlateCarree(central_longitude=180)})

ax.set_extent([55, 125, 0, 50])
ax.gridlines(
    draw_labels=["left", "bottom"],
    color="grey",
    alpha=0.5, linestyle="--"
)
ax.coastlines(color="k", lw = 0.5, resolution = "50m")
ax.add_geometries(
    tp_basins_polygon.geometry,
    crs = ccrs.PlateCarree(),
    facecolor = "lightblue",
    edgecolor = "r",
    lw = 1
)
ax.set_title("`transfer_boundary_to_polygon` polygon result")
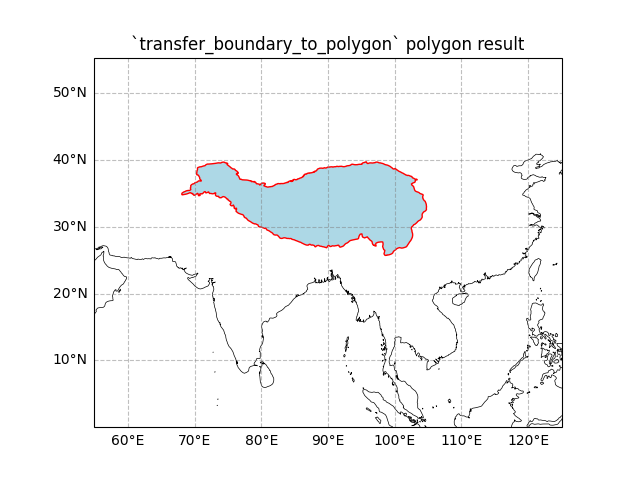
Text(0.5, 1.0, '`transfer_boundary_to_polygon` polygon result')
Summary
This example demonstrates a complete workflow for processing basin geometries:
Load the Tibetan Plateau basin dataset
Visualize individual basins with geographic context
Dissolve all basins into a single geometry
Extract only the outer boundary (excluding internal holes)
Reconstruct a clean polygon from the boundary
The key functions used are:
easyclimate_map.get_Tibetan_Plateau_basins(): Load basin dataeasyclimate_map.extract_outer_boundary(): Extract exterior boundaries onlyeasyclimate_map.transfer_boundary_to_polygon(): Convert boundaries back to polygons
This workflow is particularly useful when you need to create a clean outer boundary for a region composed of multiple adjacent or overlapping polygons.
Total running time of the script: (0 minutes 6.575 seconds)