Note
Go to the end to download the full example code.
Clip Sample
Demonstrate clipping gridded meteorological fields with administrative boundaries. This example overlays precipitation (filled contours), 500 hPa geopotential height (contours), and 850 hPa wind vectors, then clips the layers to selected provinces.
import easyclimate_map as eclmap
import matplotlib.pyplot as plt
import cartopy.crs as ccrs
import xarray as xr
import numpy as np
import cmaps
<easyclimate-map notice>: Maps are provided as-is. Users assume all risk. No
liability. No political or territorial claims.
Load demo dataset
Use the bundled ERA5 circulation sample to drive the plotting examples.
era5_circulation_1973062200_data = xr.open_dataset("era5_circle_1973062200.nc")
era5_circulation_1973062200_data
Prepare variables for plotting. - Wind vectors are thinned for clearer arrows. - Z500 and precipitation are plotted as contours and filled contours.
draw_uv850_data = era5_circulation_1973062200_data[["u850", "v850"]].thin(lon = 4, lat = 4)
draw_z500_data = era5_circulation_1973062200_data["z500"]
draw_pr_data = era5_circulation_1973062200_data["pr"]
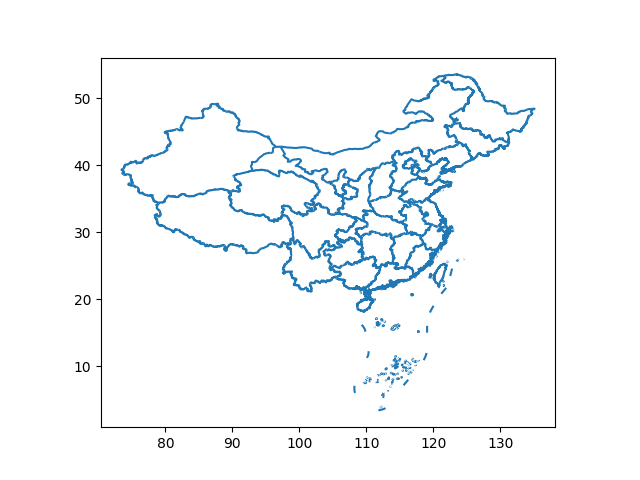
Base map: province boundaries (line)
Load and preview the province boundary lines.
zh_provinces_line = eclmap.get_zh_CN_provinces(type = "line")
zh_provinces_line.plot()
<Axes: >
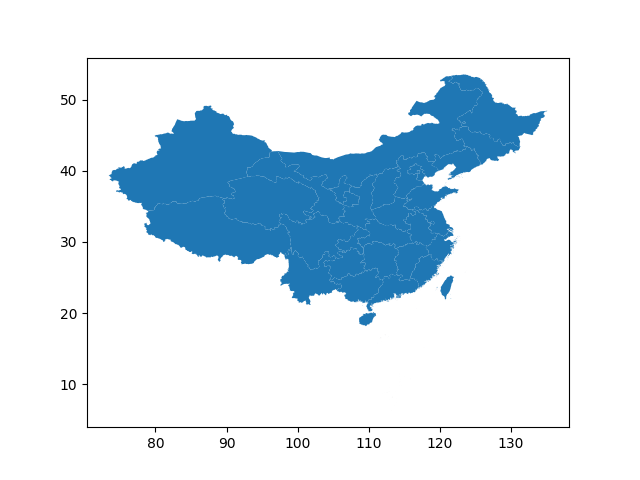
Base map: province boundaries (polygon)
Load and preview the province boundary polygons.
zh_provinces_polygon = eclmap.get_zh_CN_provinces(type = "polygon")
zh_provinces_polygon.plot()
<Axes: >
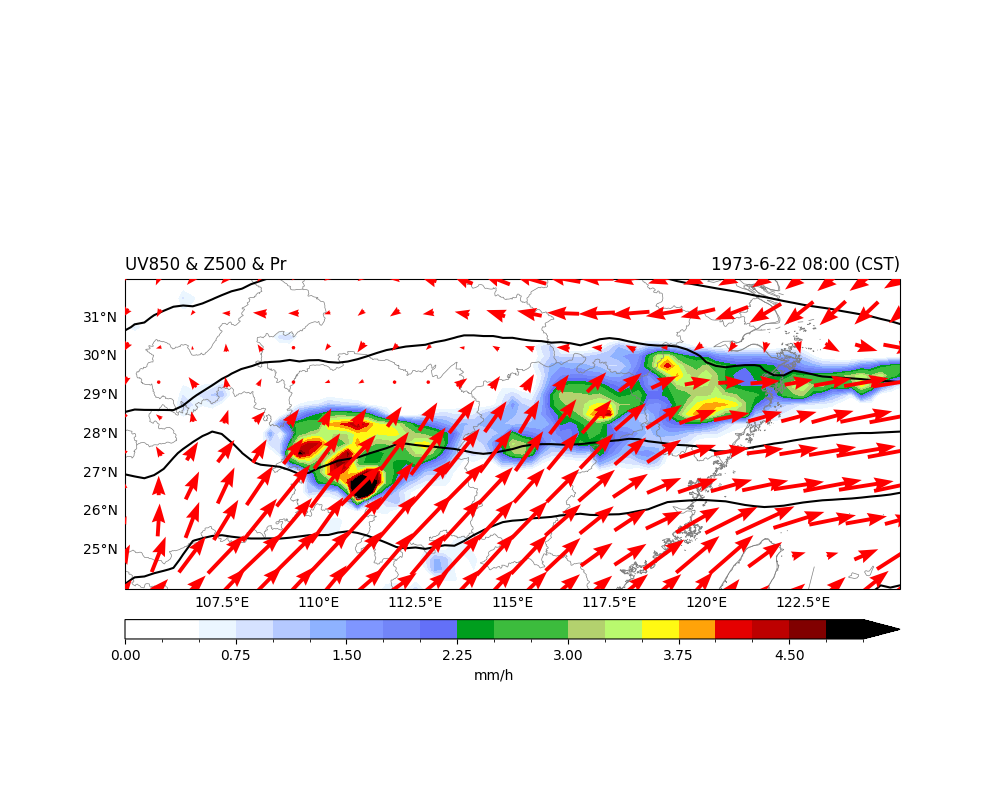
Full-domain overlay
Plot precipitation, Z500 contours, and 850 hPa winds across the region.
fig, ax = plt.subplots(
    figsize = (10, 8),
    subplot_kw={"projection": ccrs.PlateCarree(central_longitude=180)},
)

ax.set_extent([105, 125, 24, 32], crs = ccrs.PlateCarree())
ax.gridlines(crs=ccrs.PlateCarree(), draw_labels=["bottom", "left"], alpha = 0)
ax.coastlines(color="grey", linewidths=0.5, resolution = "50m")
ax.add_geometries(
    zh_provinces_line.geometry,
    crs = ccrs.PlateCarree(),
    facecolor = "none",
    edgecolor = "grey",
    alpha = 1,
    lw = 0.5
)

draw_pr_data.plot.contourf(
    ax = ax,
    levels = np.linspace(0, 5, 21),
    cmap = cmaps.precip2_17lev,
    transform = ccrs.PlateCarree(),
    cbar_kwargs = {'location': 'bottom', 'aspect': 40, 'pad': 0.05, 'label': 'mm/h'},
    zorder = 1.2
)

draw_z500_data.plot.contour(
    ax = ax,
    levels = 41,
    colors = "k",
    transform = ccrs.PlateCarree(),
    extend='both',
    zorder = 2
)

draw_uv850_data.plot.quiver(
    x = "lon", y = "lat", u = "u850", v = "v850",
    color = "r",
    scale = 200,
    regrid_shape = 10,
    headwidth = 3.5,
    width = 0.005,
    add_guide = False,
    transform = ccrs.PlateCarree(),
    zorder = 3,
)

ax.set_title("UV850 & Z500 & Pr", loc = "left")
ax.set_title("")
ax.set_title("1973-6-22 08:00 (CST)", loc = "right")
Text(1.0, 1.0, '1973-6-22 08:00 (CST)')
Filter target provinces
Select Hunan, Jiangxi, and Zhejiang for regional clipping.
gdf = zh_provinces_polygon
item_name = ['湖南省', '江西省', '浙江省']

hjz_provinces_polygon = gdf[gdf['NAME'].isin(item_name)]
hjz_provinces_polygon
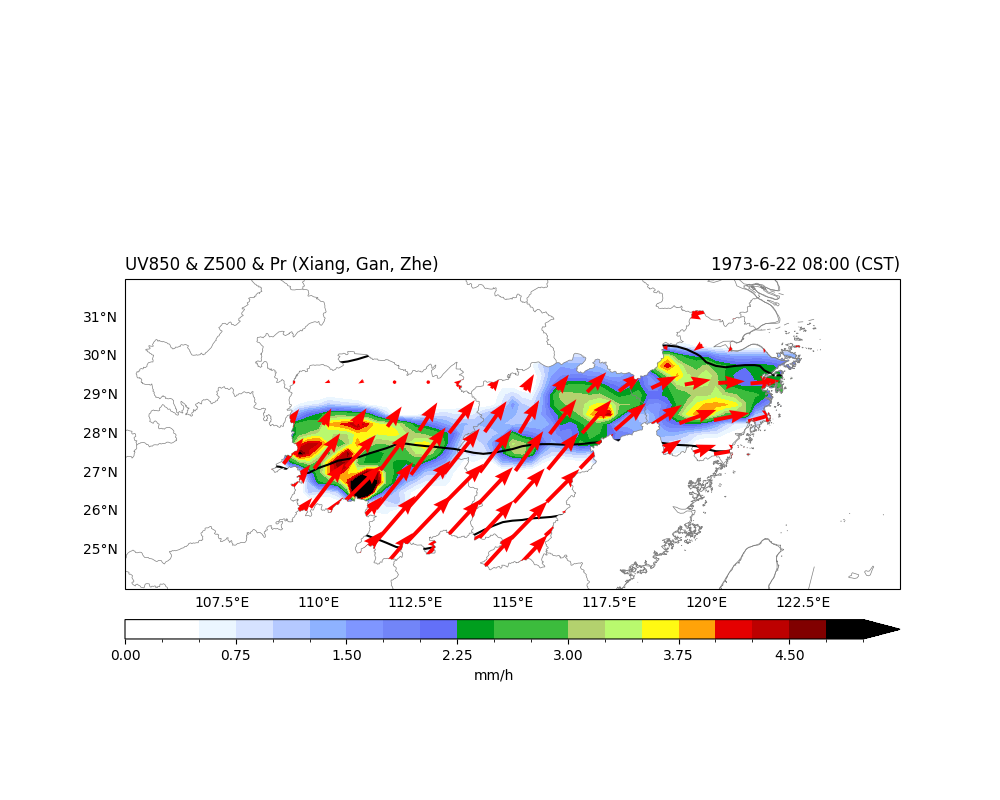
Clip by selected provinces (union geometry)
Use the provinces polygon geometry as a clip path.
fig, ax = plt.subplots(
    figsize = (10, 8),
    subplot_kw={"projection": ccrs.PlateCarree(central_longitude=180)},
)

ax.set_extent([105, 125, 24, 32], crs = ccrs.PlateCarree())
ax.gridlines(crs=ccrs.PlateCarree(), draw_labels=["bottom", "left"], alpha = 0)
ax.coastlines(color="grey", linewidths=0.5, resolution = "50m")
ax.add_geometries(
    zh_provinces_line.geometry,
    crs = ccrs.PlateCarree(),
    facecolor = "none",
    edgecolor = "grey",
    alpha = 1,
    lw = 0.5
)

clip = eclmap.get_geometry_path(hjz_provinces_polygon, ax)

draw_pr_data.plot.contourf(
    ax = ax,
    levels = np.linspace(0, 5, 21),
    cmap = cmaps.precip2_17lev,
    transform = ccrs.PlateCarree(),
    cbar_kwargs = {'location': 'bottom', 'aspect': 40, 'pad': 0.05, 'label': 'mm/h'},
    zorder = 1.2,
    clip_path = clip["transform_clip_path"],
)

draw_z500_data.plot.contour(
    ax = ax,
    levels = 41,
    colors = "k",
    transform = ccrs.PlateCarree(),
    extend='both',
    zorder = 2,
    clip_path = clip["transform_clip_path"],
)

draw_uv850_data.plot.quiver(
    x = "lon", y = "lat", u = "u850", v = "v850",
    color = "r",
    scale = 200,
    regrid_shape = 10,
    headwidth = 3.5,
    width = 0.005,
    add_guide = False,
    transform = ccrs.PlateCarree(),
    zorder = 3,
    clip_path = clip["transform_clip_path"],
)

ax.set_title("UV850 & Z500 & Pr (Xiang, Gan, Zhe)", loc = "left")
ax.set_title("")
ax.set_title("1973-6-22 08:00 (CST)", loc = "right")
Text(1.0, 1.0, '1973-6-22 08:00 (CST)')
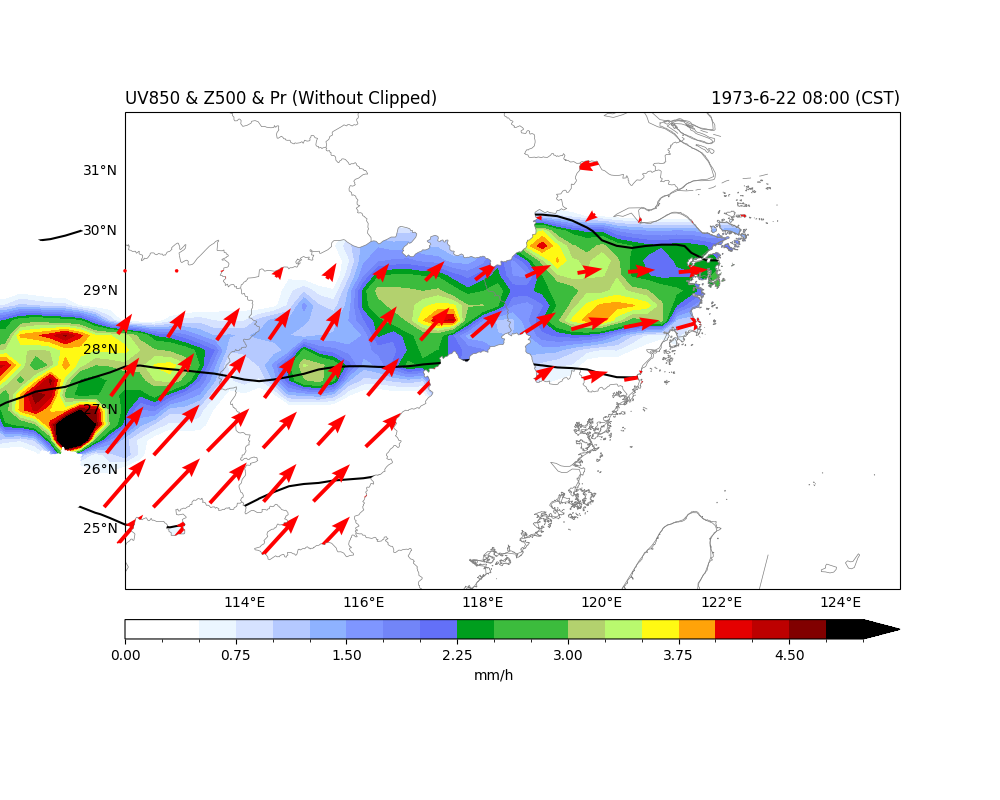
Zoomed view (without rectangle clipping)
Move extent, and compare with the same region but without applying the rectangle clip.
fig, ax = plt.subplots(
    figsize = (10, 8),
    subplot_kw={"projection": ccrs.PlateCarree(central_longitude=180)},
)

ax.set_extent([112, 125, 24, 32], crs = ccrs.PlateCarree())
ax.gridlines(crs=ccrs.PlateCarree(), draw_labels=["bottom", "left"], alpha = 0)
ax.coastlines(color="grey", linewidths=0.5, resolution = "50m")
ax.add_geometries(
    zh_provinces_line.geometry,
    crs = ccrs.PlateCarree(),
    facecolor = "none",
    edgecolor = "grey",
    alpha = 1,
    lw = 0.5
)

clip = eclmap.get_geometry_path(hjz_provinces_polygon, ax)

draw_pr_data.plot.contourf(
    ax = ax,
    levels = np.linspace(0, 5, 21),
    cmap = cmaps.precip2_17lev,
    transform = ccrs.PlateCarree(),
    cbar_kwargs = {'location': 'bottom', 'aspect': 40, 'pad': 0.05, 'label': 'mm/h'},
    zorder = 1.2,
    clip_path = clip["transform_clip_path"],
)

draw_z500_data.plot.contour(
    ax = ax,
    levels = 41,
    colors = "k",
    transform = ccrs.PlateCarree(),
    extend='both',
    zorder = 2,
    clip_path = clip["transform_clip_path"],
)

draw_uv850_data.plot.quiver(
    x = "lon", y = "lat", u = "u850", v = "v850",
    color = "r",
    scale = 200,
    regrid_shape = 10,
    headwidth = 3.5,
    width = 0.005,
    add_guide = False,
    transform = ccrs.PlateCarree(),
    zorder = 3,
    clip_path = clip["transform_clip_path"],
)

ax.set_title("UV850 & Z500 & Pr (Without Clipped)", loc = "left")
ax.set_title("")
ax.set_title("1973-6-22 08:00 (CST)", loc = "right")
Text(1.0, 1.0, '1973-6-22 08:00 (CST)')
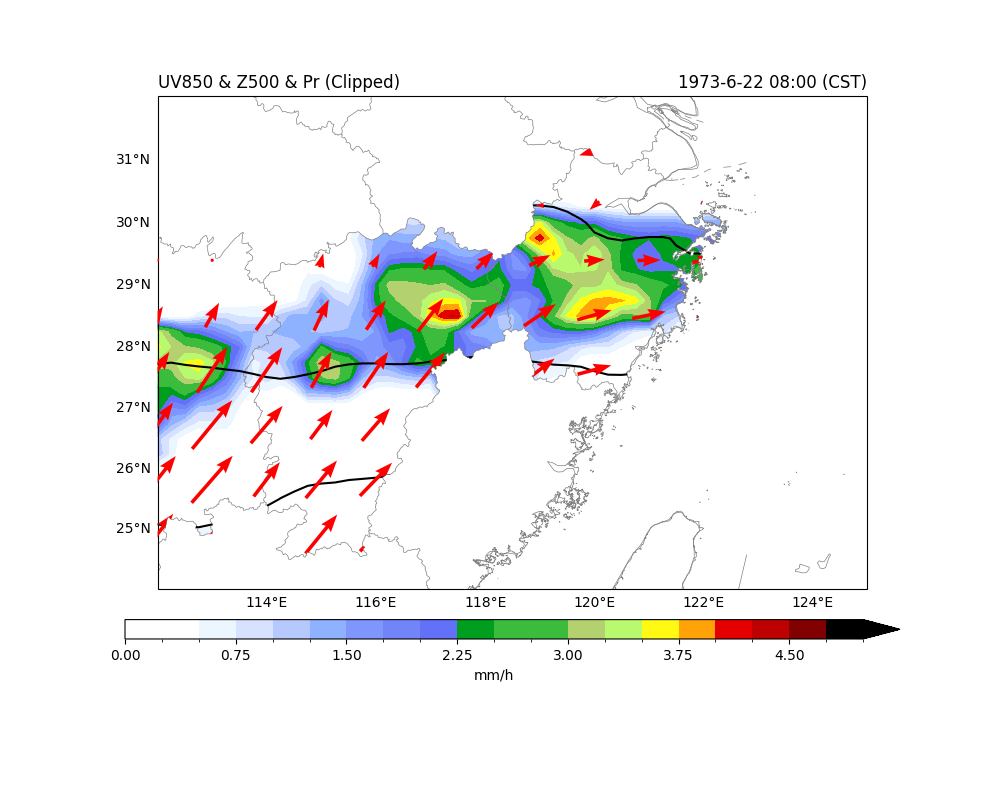
Zoomed view (rectangle clipped)
To solve this error, we need to clip the target provinces to a rectangular extent, then apply the clip path.
fig, ax = plt.subplots(
    figsize = (10, 8),
    subplot_kw={"projection": ccrs.Mercator(central_longitude=180)},
)

ax.set_extent([112, 125, 24, 32], crs = ccrs.PlateCarree())
ax.gridlines(crs=ccrs.PlateCarree(), draw_labels=["bottom", "left"], alpha = 0)
ax.coastlines(color="grey", linewidths=0.5, resolution = "50m")
ax.add_geometries(
    zh_provinces_line.geometry,
    crs = ccrs.PlateCarree(),
    facecolor = "none",
    edgecolor = "grey",
    alpha = 1,
    lw = 0.5
)

hjz_provinces_polygon_clip = eclmap.clip_rectangle_geometry(
    hjz_provinces_polygon,
    [112, 125, 24, 32]
)
clip = eclmap.get_geometry_path(hjz_provinces_polygon_clip, ax)

draw_pr_data.plot.contourf(
    ax = ax,
    levels = np.linspace(0, 5, 21),
    cmap = cmaps.precip2_17lev,
    transform = ccrs.PlateCarree(),
    cbar_kwargs = {'location': 'bottom', 'aspect': 40, 'pad': 0.05, 'label': 'mm/h'},
    zorder = 1.2,
    clip_path = clip["transform_clip_path"],
)

draw_z500_data.plot.contour(
    ax = ax,
    levels = 41,
    colors = "k",
    transform = ccrs.PlateCarree(),
    extend='both',
    zorder = 2,
    clip_path = clip["transform_clip_path"],
)

draw_uv850_data.plot.quiver(
    x = "lon", y = "lat", u = "u850", v = "v850",
    color = "r",
    scale = 200,
    regrid_shape = 10,
    headwidth = 3.5,
    width = 0.005,
    add_guide = False,
    transform = ccrs.PlateCarree(),
    zorder = 3,
    clip_path = clip["transform_clip_path"],
)

ax.set_title("UV850 & Z500 & Pr (Clipped)", loc = "left")
ax.set_title("")
ax.set_title("1973-6-22 08:00 (CST)", loc = "right")
Text(1.0, 1.0, '1973-6-22 08:00 (CST)')
Total running time of the script: (0 minutes 22.257 seconds)