Note
Go to the end to download the full example code.
Formatting Coordinates#
Before proceeding with all the steps, first import some necessary libraries and packages
import easyclimate as ecl
import matplotlib.pyplot as plt
import matplotlib.ticker as ticker
import cartopy.crs as ccrs
The data we use here is monthly data from Jan 2022 to Feb 2022 and contains 17 vertical levels.
Formatting of the Latitude and Lontitude Tickes#
draw_data1 is extracted from time level 0 and 500hPa vertical level.
draw_data1 = u_data.isel(time=0).sel(level=500)
draw_data1
Now we call xarray.plot.pcolormesh to plot the latitudinal wind field on the 500hPa isobaric surface.
Noting that the x-axis and y-axis are not in standard geographic coordinate format, our next step is to format these coordinates.
fig, ax = plt.subplots(1, 1)

draw_data1.plot.pcolormesh(
    ax=ax,
)
![time = 2022-01-01, level = 500.0 [millibar]](../_images/sphx_glr_plot_formatting_coordinates_001.png)
<matplotlib.collections.QuadMesh object at 0x7fe731e18f70>
easyclimate.plot.set_lon_format_axis,
easyclimate.plot.set_lat_format_axis can help us quickly
format the coordinates on the x-axis and y-axis, respectively, into a geographic coordinate format.
fig, ax = plt.subplots(1, 1)

draw_data1.plot.pcolormesh(
    ax=ax,
)

ecl.plot.set_lon_format_axis(ax, axis="x")
ecl.plot.set_lat_format_axis(ax, axis="y")
![time = 2022-01-01, level = 500.0 [millibar]](../_images/sphx_glr_plot_formatting_coordinates_002.png)
It is worth mentioning that the easyclimate.plot.set_lon_format_axis,
easyclimate.plot.set_lat_format_axis methods contain a parameter dmi
which helps us to convert DD (Decimal Degrees) format to DMS (Degrees Minutes Seconds) format.
Now let’s start by selecting a smaller area
draw_data1_1 = (
    u_data.isel(time=0).sel(level=500).sel(lon=slice(100, 110), lat=slice(20, 23))
)
draw_data1_1
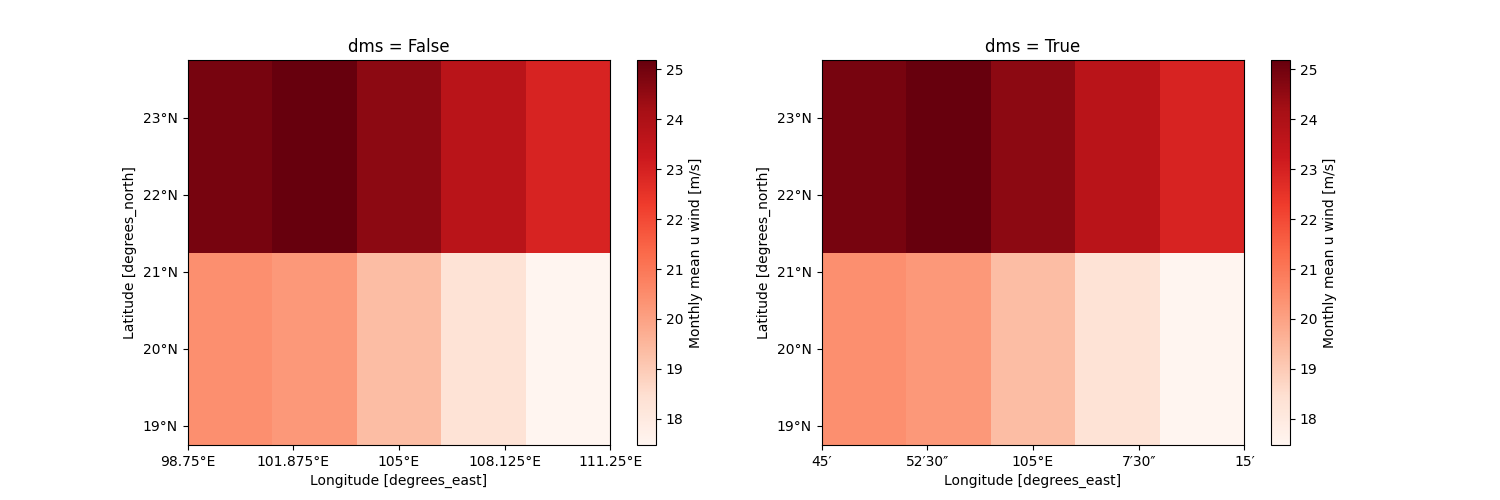
Note the difference in geo-labeling on the x-axis.
fig, ax = plt.subplots(1, 2, figsize=(15, 5))

for axi in ax.flat:
    draw_data1_1.plot(ax=axi, cmap="Reds")
    axi.xaxis.set_major_locator(ticker.LinearLocator(5))

ecl.plot.set_lon_format_axis(ax[0], axis="x")
ecl.plot.set_lat_format_axis(ax[0], axis="y")
ax[0].set_title("dms = False")

ecl.plot.set_lon_format_axis(ax[1], axis="x", dms=True)
ecl.plot.set_lat_format_axis(ax[1], axis="y", dms=True)
ax[1].set_title("dms = True")
Text(0.5, 1.0, 'dms = True')
Barometric Profile Label Formatting#
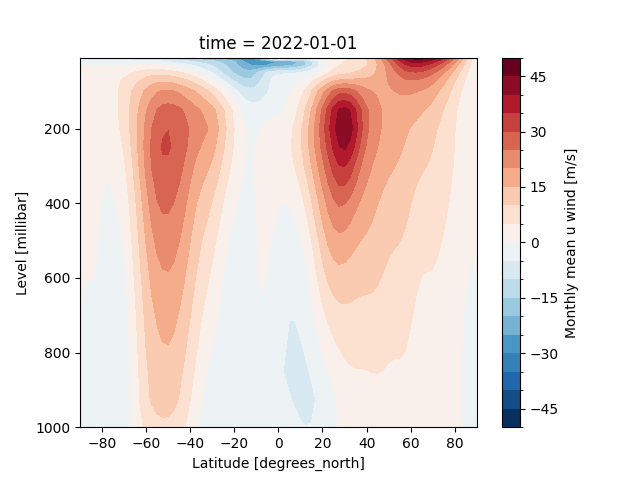
Here we choose the longitudinally averaged latitudinal direction at time level 0 to plot the profile
draw_data2 = u_data.isel(time=0).mean(dim="lon")
Notice that the x-axis and y-axis labels are unformatted, so we’ll take care of that next.
fig, ax = plt.subplots(1, 1)

draw_data2.plot.contourf(ax=ax, levels=21, yincrease=False)
<matplotlib.contour.QuadContourSet object at 0x7fe72f81cdf0>
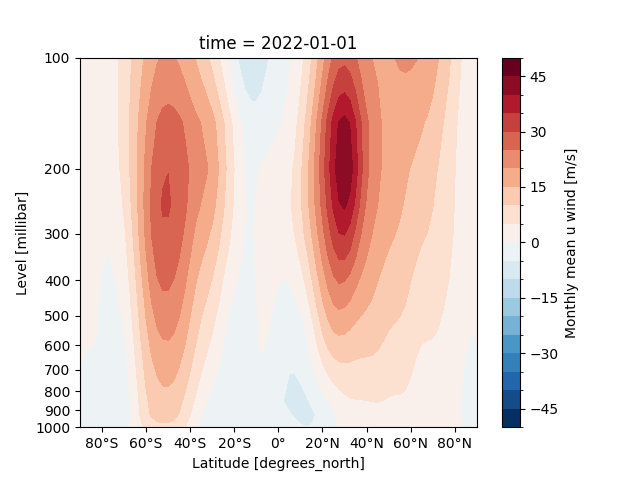
easyclimate.plot.set_p_format_axis can help us format barometric vertical labels
and similarly easyclimate.plot.set_lat_format_axis can help us format latitude labels.
fig, ax = plt.subplots(1, 1)

draw_data2.plot.contourf(ax=ax, levels=21, yincrease=False)

ecl.plot.set_lat_format_axis(ax, axis="x")
ecl.plot.set_p_format_axis(ax, axis="y")
Polar Stereo of the Circle Boundary#
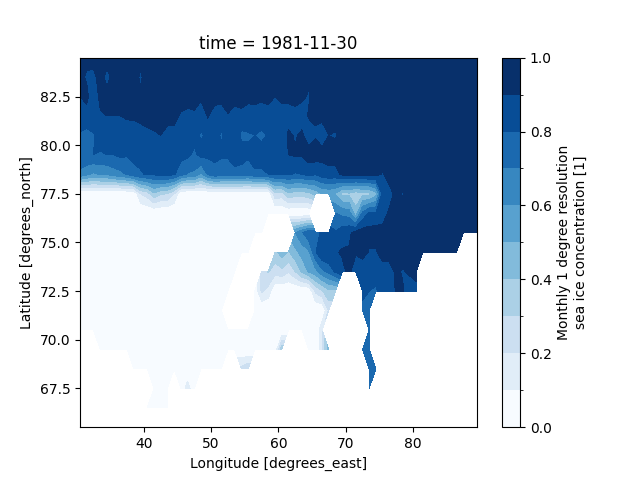
For the sake of illustration, we use here the sea ice concentration (SIC) data from the Barents-Kara Seas (30°−90°E, 65°−85°N). The results of the data under the 10th time level are described below.
<matplotlib.contour.QuadContourSet object at 0x7fe72f5fdd20>
easyclimate.plot.draw_Circlemap_PolarStereo helps us to easily
establish the boundary of the circle under the projection of the polar stereo.
fig, ax = plt.subplots(subplot_kw={"projection": ccrs.NorthPolarStereo()})

ax.coastlines(edgecolor="black", linewidths=0.5)
ax.stock_img()

ecl.plot.draw_Circlemap_PolarStereo(
    ax=ax,
    lon_step=30,
    lat_step=10,
    lat_range=[50, 90],
    draw_labels=True,
    gridlines_kwargs={"color": "grey", "alpha": 0.5, "linestyle": "--"},
)

sic_data.plot.contourf(cmap="Blues", levels=11, transform=ccrs.PlateCarree())
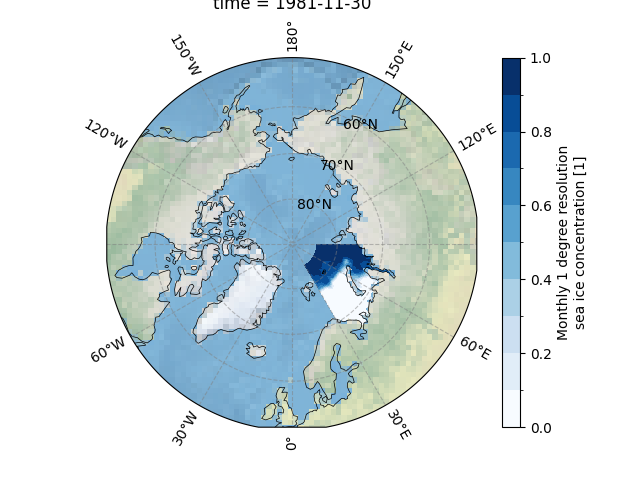
<cartopy.mpl.contour.GeoContourSet object at 0x7fe72f514d90>
Adjusting north_pad and south_pad appropriately can help us compensate for not completing the circle boundaries.
fig, ax = plt.subplots(subplot_kw={"projection": ccrs.NorthPolarStereo()})

ax.coastlines(edgecolor="black", linewidths=0.5)
ax.stock_img()

ecl.plot.draw_Circlemap_PolarStereo(
    ax=ax,
    lon_step=30,
    lat_step=10,
    lat_range=[50, 90],
    draw_labels=True,
    set_map_boundary_kwargs={"north_pad": 0.3, "south_pad": 0.4},
    gridlines_kwargs={"color": "grey", "alpha": 0.5, "linestyle": "--"},
)

sic_data.plot(cmap="Blues", levels=11, transform=ccrs.PlateCarree())
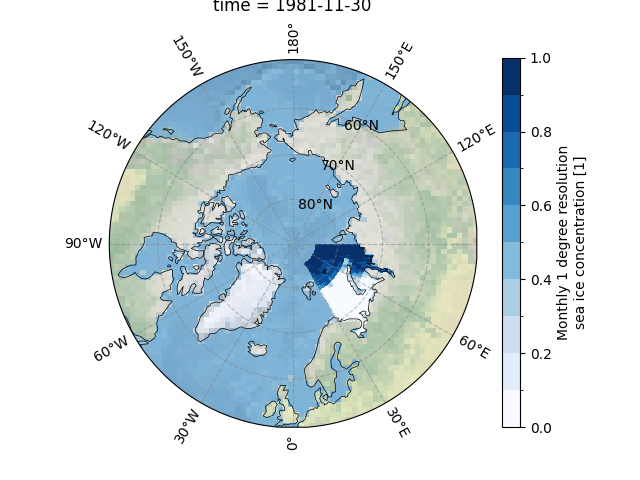
<cartopy.mpl.geocollection.GeoQuadMesh object at 0x7fe72f274cd0>
Total running time of the script: (0 minutes 6.662 seconds)